


 MENU
MENUForecasting is very difficult, especially about the future. —Old Danish Proverb
In previous blogs I’ve introduced the Trillion Cell Challenge and given the motivation for why it is a worthy goal. Now I’d like to start discussing the technical obstacles involved in visualizing a solution with one trillion cells.
Basic Visualization Pipeline
The basic visualization pipeline is shown in the figure below.
- The process starts with reading the solution data off a storage system. Usually these files are quite large so they are primarily stored on arrays of hard disks.
- The next step is to transfer the data across a network (or the computer bus for local hard disks) to the computer where the visualization objects are extracted.
- The computer extracts visualization abstractions such as slices, isosurfaces, or streamtraces and a graphics card renders the final image.
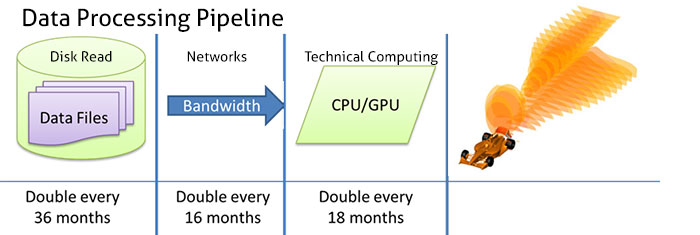
Data read/write is the current rate determining step in the visualization pipeline.
Each step takes time, and the performance of each component evolves at a different rate. In order to design a visualization architecture that will perform well in the year 2030, we need to predict the future performance of each of the steps in the graphics pipeline.
Technical Computing Performance
As we have already discussed, CPU performance is doubling roughly every 18 months. This is the classic Moore’s law. Many people have been predicting the demise of Moore’s law—as they have been for a couple decades now—but it seems likely it will continue for at least another decade. As the popular saying goes: “The number of people predicting the demise of Moore’s law doubles every 18 months.”
Network Performance
Network performance is more difficult to predict. There are so many different types of networks that concern us: local area networks, wide-area networks, the internet, wi-fi. It is hard to come up with a general prediction for all of them. The best data I’ve seen, with a high degree of uncertainty, is that the performance of LANs and WANs will double roughly every 16 months. Since data size doubles every 18 months, the time it takes to transfer a typical file across the network should decrease over time.
Hard Disk Read Performance
The step that is improving the slowest, it turns out, is reading the data off the hard disk. At the heart of the hard disk system is a set of spinning magnetic platters. The rate at which data can be read from the disk is a function of the lineal density of the magnetic dots on the disk and the spinning rate of the disk. The spinning rate of the disk is limited by the structural strength of the disk material so it is unlikely to increase rapidly. The density of the magnetic dots increases somewhat faster. The net result is that the disk-read bandwidth is only predicted to double every 36 months—far slower than the other components. This will be the true bottleneck in the visualization pipeline.
Hard Disk Capacity
Interestingly, the capacity of the hard disk is increasing much faster than the disk-read performance. Capacity increases with the areal density of the magnetic dots (dots per square centimeter) whereas the read performance increases with the lineal density (dots per centimeter). As the dot spacing decreases, the areal density increases with the square of the lineal density. The hard disk capacity is currently doubling every 12 months (Kryder’s law). This is why hard disks remain the dominant storage device.
Trends and Predictions
After analyzing all these trends, we’ve generated predictions for how long it takes to read the large data file that is doubling in size every 18 months, from the hard disk and transfer it across a local area network. The results are shown in the left-hand plot below. As mentioned earlier, the time to transfer data across the LAN is actually decreasing over time while the time to read the data from the hard disk is increasing rapidly. This analysis shows that the network transfer time was dominant up until 2006 but that the time to read the data from the disk has dominated since. For different network types, wide-area networks for example, the cross-over date is later but the basic trends are the same. The results are even more dramatic if you extend the analysis out to 2030, as shown in the right-hand plot below. As you can see, the contribution of the network transfer time is so small it is barely visible. Reading the data from hard disk dominates more and more as time goes on.
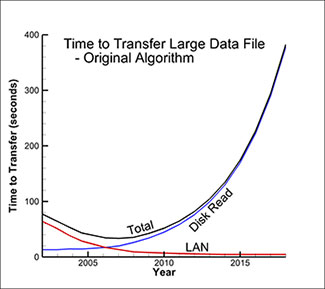
Original algorithm showing time to transfer large data file.
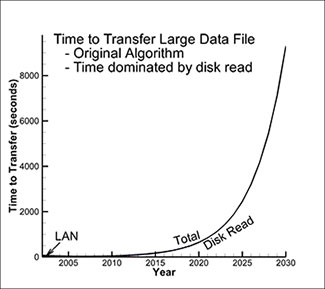
Reading the data from hard disk dominates as time goes on.
I’ve demonstrated that reading the data from the disk is the primary obstacle to visualization performance in the future. In the next blog I’ll discuss how we overcome this bottleneck.
Blogs in the Trillion Cell Grand Challenge Series
Blog #1 The Trillion Cell Grand Challenge
Blog #2 Why One Trillion Cells?
Blog #3 What Obstacles Stand Between Us and One Trillion Cells?
Blog #4 Intelligently Defeating the I/O Bottleneck
Blog #5 Scaling to 300 Billion Cells – Results To Date
Blog #6 SZL Data Analysis—Making It Scale Sub-linearly
Blog #7 Serendipitous Side Effect of SZL Technology