


 MENU
MENUTo coincide with this month’s release of Tecplot RS 2015 Release 1, we thought it would be beneficial to our readers to discuss the new version with Tecplot co-founder Don Roberts.
As many of you know, Don co-founded Tecplot Inc. (which was originally called Amtec Engineering) with Chairman Mike Peery in 1981. Both former Boeing engineers, Don and Mike have been at the helm of our privately held company since its inception.
In 2003, Don was the driving force behind the initial release of Tecplot RS, a software product designed specifically for reservoir engineers to visualize and analyze data from oil & gas reservoir simulations. Since then, Tecplot RS has grown to represent about 15 percent of the company’s total annual revenue.
In the Q&A below, we’ll discuss with Don the oil & gas industry in general and get an inside look at where Tecplot RS is today and where it’s going.
Question: How has the oil & gas market changed since Tecplot RS was launched in 2003?
Roberts: The price of oil has gone through several gyrations since 2003. It was in the $30 range during 2002 as we developed RS. Then after the first launch it took off on a multi-year climb to $145, followed by the crash of 2008, followed by another multi-year rise and the current crash due to over-supply. Advances in horizontal well drilling and fracking of shale oil fields in recent years was a large contributor to this. During the first several years after the launch there was a lot of consolidation going on with the larger oil companies, so there are fewer major oil companies today.
In the reservoir simulation world, there has been a significant move towards a statistical approach to modeling oil reservoirs where numerous simulations are performed on multiple models. Previously, a deterministic approach was dominant where reservoir engineers strived to create one model for a reservoir. Now, engineers need tools to help them view and compare multiple solutions. This is the sweet spot for Tecplot RS.
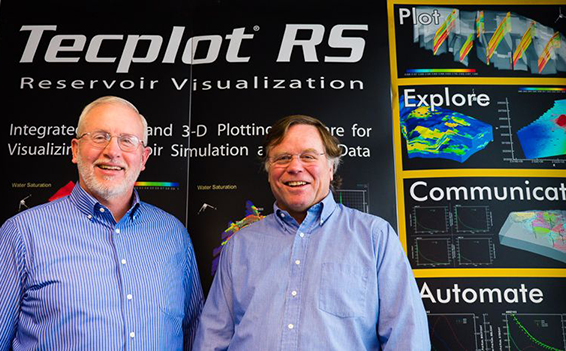
Co-founder Don Roberts and Mike Peery are pictured. Don discusses Tecplot’s software that helps reservoir engineers visualize and analyze data from oil & gas reservoir simulations.
Question: What do reservoir engineers use if they don’t use Tecplot RS? In other words, what are the alternatives?
Roberts: The companies that develop the commercial reservoir simulators typically develop pre- and post-processing tools. These include Schlumberger, Haliburton, CMG, Roxar, and others. There are a few small companies that develop plotting and visualization applications specifically for reservoir simulation data. One product that has been around a little longer than RS is called S3Graf. I’m obviously biased, but we believe Tecplot RS is a superior solution because we place extreme emphasis on input from customers and prospects when developing each and every release.
Question: What are the typical challenges faced by reservoir engineers?
Roberts: Reservoir engineers are constantly under time pressures. They need to generate dozens of simulations and evaluate them quickly. They need to make good well-informed decisions because drilling new wells is expensive. With Tecplot RS, we’ve given them a tool that addresses both of these demands.
Question: How do you prioritize what functionality goes into a new release?
Roberts: As I mentioned earlier, we get a lot of unsolicited feedback from our customers, and we talk to prospects to find out their needs. Each year we systematically evaluate the requests to look for trends and commonality. Then we poll our advisory council and several other key reservoir engineers to help us prioritize. Frankly, we do pay close attention to the priorities of some of our biggest customers like Chevron. We try to stay away from features that we think would be merely cool and focus on what will differentiate Tecplot RS from other products in the market.
Question: In your role as RS product manager, what are your duties and priorities?
Roberts: Quite simply, I am the proxy for the reservoir engineering market to Tecplot, and I am the advocate for Tecplot RS to this market. In a small company like ours, product managers have many roles. My duties include talking to the market to understand the needs, prioritizing the new features and functionalities to make sure our developers have a steady stream of work, coordinating and planning new releases, presenting new features to customers and prospects, providing training to new users, and preparing product information for marketing. I work closely with development, sales, and technical support to make sure we deliver the best product. The highest priority is to add functionality to RS that provides the greatest value to our users. These are often features that differentiate RS from competitors.
Question: What’s most important about this new release — either from a functionality standpoint or a future-direction-of-the-product standpoint?
Roberts: A couple things are important in the new release. We added a new approach for generating bubble plots using pie chart symbols attached to the wells in a plot of the reservoir model. The pie-chart symbols display the production data for the wells, where each segment of the “pie” represents a variable like oil, water, and gas production rates. The reservoir model provides a visualization of the movement of the reservoir fluids. With the pie-chart bubble plots the engineer can combine the production data with the reservoir dynamics to gain a holistic view of what is going on in their reservoir model over the time period of the simulation.
We also have added a capability to visualize models with multiple reservoirs. Some simulators, such as NEXUS, are able to model oil fields that have multiple disconnected reservoirs that may be separated by impermeable rock. They need to be modeled together since the wells share the above-ground piping system, which influences the production in each reservoir. This new capability is very important to many of our larger customers.
Question: What can reservoir engineers expect from future releases of Tecplot RS? What is the product roadmap?
Roberts: We have a never-ending supply of feature requests. We need to support additional data formats that are common in the market. This allows more users to bring their data into RS. There is also a need for viewing models with unstructured grids, so we will be addressing that. Users want more options for comparing data from different sources. We have found that analysis tools get the biggest reaction from customers and prospects, so we will continue to develop those types of features.
Question: What’s most satisfying about your job as Tecplot president and RS product manager?
Roberts: It is very satisfying to be connected into the world of visualization, analysis, and simulation. This is what I have done my whole career. As president, I get to work with a very talented management team, and it is gratifying to know that they are capable of leading our company and handling any issues that come our way.