


 MENU
MENUThis video will demonstrate time animation using the Probe to Create Time Series Plot tool as an example. We will create an XY line plot on top of a contour plot, link the frames by solution time, and provide time animation export recommendations.
Probe Over Time Plot
Starting with a simple 2D transient plot, our goal is to create a probe over time plot which will graph the data in a separate XY line frame.
First, select Tools > Probe to Create Time Series Plot, and click on the plot in a region of interest.
This creates an XY line plot on screen.
Second, select Frame>Frame Linking… and you can see that both frames are linked by solution time. If we un-toggle this option for either of the plots, they will not play concurrently. Leave these frames linked by solution time.
Notice also that the XY plot has a Solution Time x-axis marker. Turn this on and off in the plot with a macro command. See this example for how to use that macro. If you are interested in creating an XY line plot that will draw the line as time progresses, see this other macro file on our GitHub (.mcr) as an example.
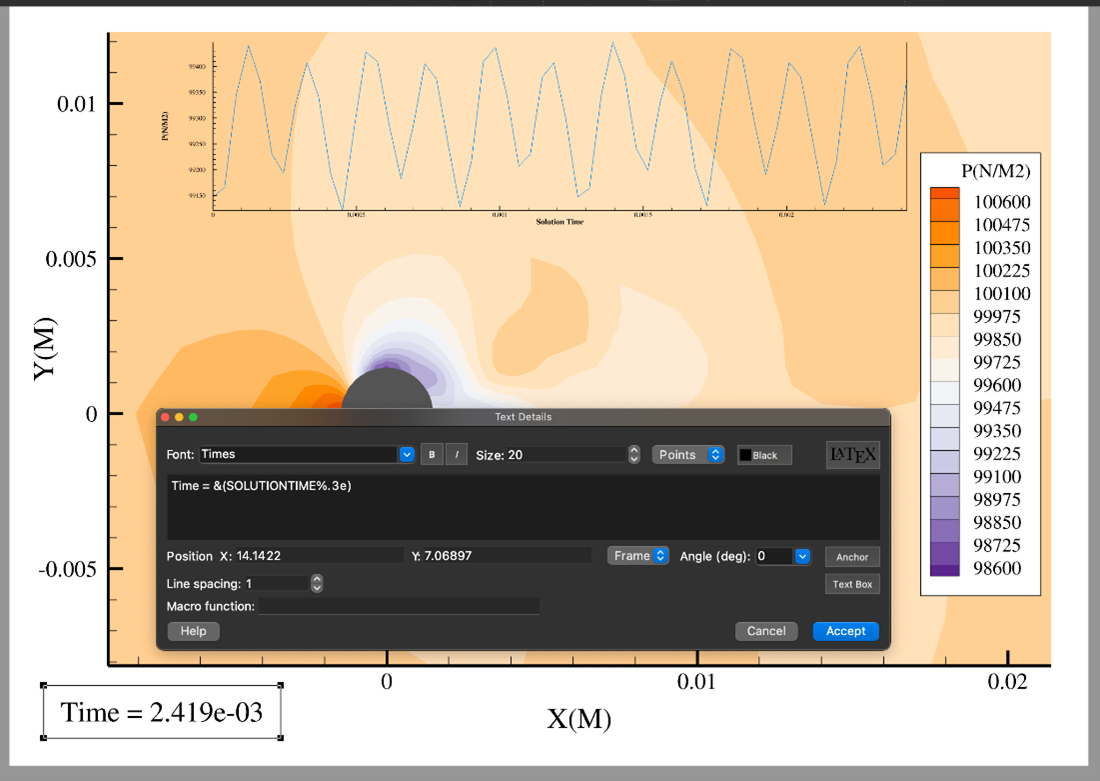
Third, move the XY Line plot on top of the 2D contour plot. Give it a transparent background by double-clicking the edge of the Frame to bring up the Edit Active Frame dialog. Toggle off Show background.
In an earlier video, we demonstrated placing text annotations on the plot. Here, we input the current solution time dynamic text on the plot in scientific notation, and increase or decrease the precision.
Export Your Animation
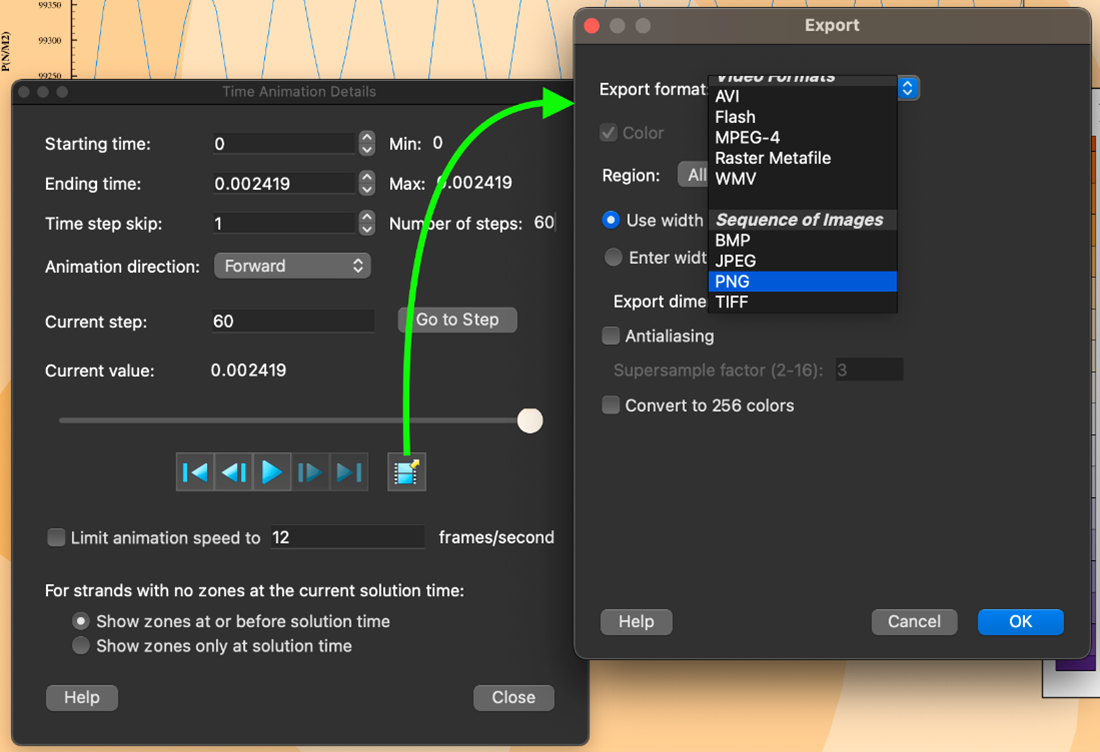
Now we are ready to export an animation of our plot. In some cases, you may want to create an .mp4 animation file directly using the Tecplot 360 GUI. However, for large data sets, we recommend exporting a sequence of images (demonstrate on screen and make sure to click antialiasing). This option can be found in the time animation details dialog after clicking export to file, and selecting Export format:
Exporting a sequence of high-quality images provides flexibility. It allows you to manually step through each image.
Additionally, using a tool such as ImageMagick or FFmpeg (executable shipped with Tecplot 360), you can create a variety of animations with different framerates, in formats like .mp4 or .gif. You can also take advantage of our GitHub script, to automate this process with Python.
If you want to export images more quickly, you can automate the process in parallel, see this parallel image creator script for more details.
This concludes this tutorial on working with transient data. Thank you for watching.