


 MENU
MENUDescription
Optimize your designs by viewing data in different ways. This video demonstrates image views, 3D scatter plots, 2D scatter plots, and constraint visualization.
This video is an example of viewing data from an optimization study for a 2D electronic actuator destined for installation on an airplane.
Start with your data already imported (see Loading Data from a CSV File video).
View the variables associated with this data set: Z, Y, X, Force, volume of the arm, volume of the steel, electronic leakage, volume of copper, and the total weight. X, Y and Z are the input or the independent variables that were varied by the optimizer. Because this actuator is going on an airplane, it needs a high force while minimizing volume, weight and electronic leakage. These are the dependent variables that drive the optimization function.
Open Matrix View by clicking on the ![]() icon in the top toolbar. Matrix View gives you an overview of the input variables. Set up your variables so that rows are Y, columns are Z, and page by X. Going through the resulting view we see:
icon in the top toolbar. Matrix View gives you an overview of the input variables. Set up your variables so that rows are Y, columns are Z, and page by X. Going through the resulting view we see:
- Varying Y changes the height.
- Varying Z changes the width of the center bar.
- Varying X changes the size of the gap.
Zoom into the images using the slider to see how the electric current runs though the actuator.
To see trends in your data, open the 3D Scatter Plot by clicking on the ![]() icon. Show weight on the x-axis, leakage on the y-axis and the force on the z-axis. Color by the volume of copper and show the legend. This view allows you to rotate the plot for better views of your data. As weight and leakage are increased, the force increases, whereas volume of copper seems to be a function of weight.
icon. Show weight on the x-axis, leakage on the y-axis and the force on the z-axis. Color by the volume of copper and show the legend. This view allows you to rotate the plot for better views of your data. As weight and leakage are increased, the force increases, whereas volume of copper seems to be a function of weight.
For more detail, open the 2D Scatter Plot by clicking on the ![]() icon. Change the x-axis to weight and the y-axis to force. Color by leakage and notice the strong relationship between weight and force.
icon. Change the x-axis to weight and the y-axis to force. Color by leakage and notice the strong relationship between weight and force.
This is an optimization case to find the best actuator design for installation on an airplane. Tecplot Chorus has filters that show your optimization parameters. In this case:
- Force should be maximized.
- Weight should be minimized (it’s being installed on an airplane).
- Copper should be minimized (it’s expensive).
- Electronic leakage should be minimized (it interferes with other electronics).
After applying the necessary filters, many points have disappeared. You can view the proximity of all cases to the constraints by changing the Coloring to Color by Filter Violations. With this setting, all of the cases are shown but colored by feasibility.
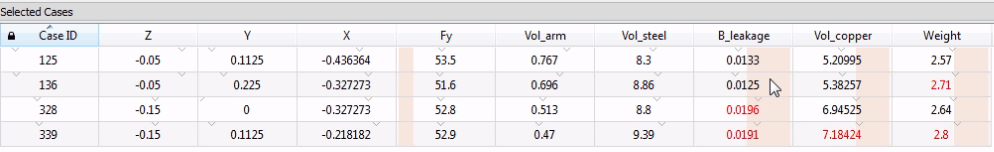
Zoom into this area and select any points to see them in the Selected Cases View, which appears at the bottom of your Tecplot Chorus window. Notice how the text changes to red when a filter is violated. The karat shows how far away the value is from the constraint.
Thanks for watching!
Try Tecplot 360 with Chorus for Free