Use Case: Plume Migration – Protecting Human Health and the Environment
SO2 (sulfur dioxide) gas emissions are the by-products of natural events like volcanic eruptions, as well as a variety of man-made industrial processes. A precursor to acid rain and a serious air pollutant, SO2 emissions can have significant negative effects on human health and the environment. As a result, the United States Environmental Protection Agency (EPA) has developed a stringent set of industry regulations regarding SO2emissions in industrial manufacturing.
Using CFD to Validate SO2 Concentration
Computational Fluid Dynamics (CFD) has become a standard methodology for validating the design of manufacturing facilities under a wide variety of circumstances. Engineers often use CFD to understand whether or not the initial design for a manufacturing facility will meet EPA standards.
This use case demonstrates how Tecplot Chorus can help engineers use CFD to efficiently determine whether the initial design for a facility would be within the EPA threshold for SO2 concentration.
The Role of the Tecplot 360 CFD Visualization Tool
With 16 design parameters in the dataset, we decided to look at variations in the SO2 gas exhaust from the plant based on prevailing wind conditions. Specifically, we wanted to determine whether or not the total amount of SO2 gas 50 meters from the source would exceed EPA standards.
We began by opening a couple of solutions in the Tecplot 360 CFD visualization tool for an initial validation of the results. An examination of one of the slices at 50 meters from the source showed a very small amount of SO2 gas coming out of the system. Contour levels were added to reveal more of the fine structure around the SO2 gas, confirming the assessment.
At this point, a style file for this image was saved to the desktop for generating subsequent images. With one result worked up, we still had more than 16 results that required between 5 and 7 views to validate the design accurately. This next step, if confined to a CFD visualization tool, can be very time-consuming because of all the simulation cases we needed to run. Organizing, managing, tracking, comparing, and finally analyzing the resulting simulation cases in a useful and meaningful manner also is problematic—if not impossible—using just a CFD visualization tool. This is where Tecplot Chorus came in.

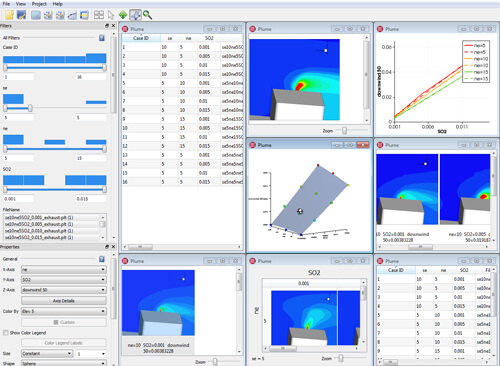
In this SO2 plume migration study, engineers were able to visualize multiple views of metadata and flow field physics in one unified environment with Tecplot Chorus.

Bringing results into Tecplot Chorus
Simulation Analytics with Tecplot Chorus Organizes Projects, Enables Deep Dives, Speeds Design Decisions
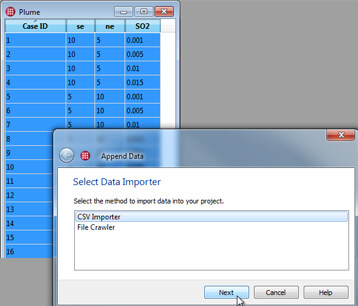
The next step was to bring the results into Tecplot Chorus to create a database of all the SO2 convection simulations based on differing wind speeds and emission rates. After using a file crawler to bring everything into the database, it was easy to quickly navigate to the actual results, each of which was in an individual file.
We then identified the parameters we wanted to compare across all the raw simulation cases in the database, selecting for southeasterly winds, northeasterly winds, and SO2 concentration. After completing these associations, the Tecplot Chorus tool pulled the information we wanted to look at from all the simulation cases into one simplified environment.
This allowed us to really start understanding what the data was telling us through a variety of investigative methods:
- Doing “deep dives” into individual simulation cases to look for the root causes of trends and anomalies
- Viewing and comparing integrated and derived quantities
- Determining the net effect of changing a parameter such as the prevailing wind conditions
- Creating surrogate models
- And, ultimately, evaluating what’s going on throughout the system.
Being able to look at the results across a single screen allowed us to continue to investigate the entire system, and understand how things may be changing within the system. We were able to zoom out, zoom in, and look at plume migration and the SO2 gas concentration easily within the unified Tecplot Chorus environment.

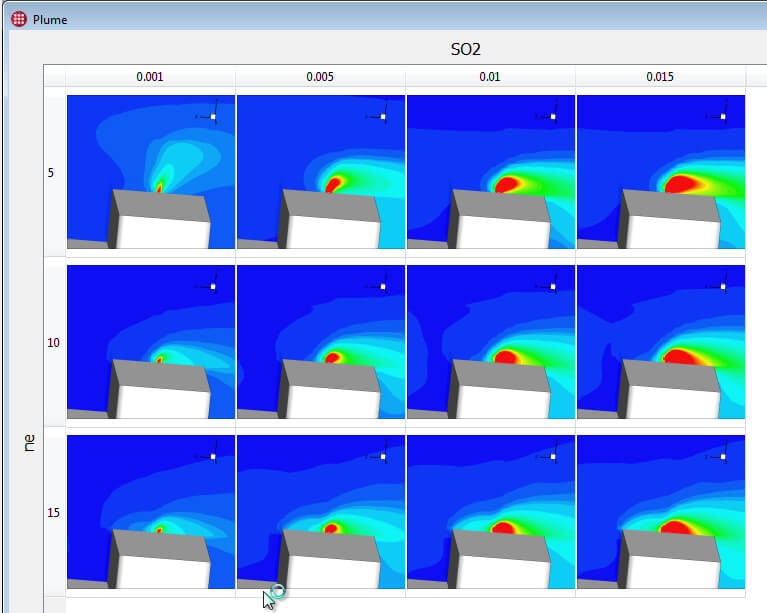
Tecplot Chorus allows engineers to compare selected plot images and field data plots in n-by-n matrices or side-by-side views.
This is a very simple way to understand the beauty of simulation analytics: here you can see the net effect of changes made within the system, making sense qualitatively as well as quantitatively.
In the end, the design engineers on this project were able to validate the initial facility design, confirming that it would fall within EPA standards-and they were able to do it in about 15 minutes,
thanks to Tecplot Chorus.


