An energy engineer and Master’s degree candidate works to solve a problem common to many companies: how to keep business data safe while maximizing server and cooling equipment efficiencies. Dana Etherington utilized Tecplot 360, a computational fluid dynamics (CFD) program, to address this issue.
The Challenge
Companies rely on servers in their data centers to store and protect information that is critical to running their business: email, financial, customer and a host of other data sets. “Servers generate an incredible heat load, and they need to be protected, because loss of the information they store can be devastating to a company,”
Etherington said.
The American Society of Heating, Refrigerating and Air-Conditioning Engineers (ASHRAE) recommends maximum server rack inlet temperatures of 80.6 degrees Fahrenheit (F). Data centers typically operate at much lower temperatures due to lack of education and understanding about safe operating parameters. This can offer companies a significant opportunity for cost savings.
“In the past, facilities would just pump an excessive amount of cold air into their spaces to make sure the heat generated by the servers was ‘managed,’” Etherington said. “Now people are more knowledgeable and want to be more energy efficient, which helps reduce their overall costs.”
Etherington chose to utilize Tecplot 360, a numerical simulation and computational fluid dynamics (CFD) visualization software tool, to help address this challenge. The software enables engineers to analyze complex data, design diverse layouts, and communicate effectively with customers before implementing a solution.
“It can sometimes be tough as a consultant to convince customers to make changes in their data centers. It is critical to show them that safe temperatures will be maintained, rather than simply stating it,” he said. He also noted that building a CFD model and running the required iterations for convergence can be time consuming, tedious and expensive when utilizing commercially available software.
The Goal:
The goal of Etherington’s project was to develop a simpler method for quickly and efficiently reviewing flow and temperature conditions within a data center, as CFD modeling software can be used to study the effects of operational and physical changes to a facility before implementation. He identified and described a way for engineers to write code that would result in “data center optimization,” which he defined as more efficient cooling of data centers. When the temperature in the data center can be safely increased and stabilized, then energy consumption by the systems can be reduced. Ultimately, this can help companies keep servers at the proper temperature for safe operation, maintain stability of data, save energy and reduce costs.
Having researched data center optimization professionally for more than four years during his engineering career, Etherington wanted to develop a basic code for scenario-based modeling, utilizing SIMPLE_HT, a FORTRAN-based compiler. He noted that Tecplot makes the planning process for data center optimization cheaper and easier. “The main goal of CFD analysis in data centers is to identify hot spots and re-circulation areas within the space. If the occurrence of these issues can be reduced then the HVAC (cooling) equipment can be operated more efficiently,” he said.
“Some people think of CFD as mythically challenging, and others think you have to go into a lot of complex analysis using multiple CFD programs. This is expensive and unnecessary. You can write the code yourself and then use Tecplot to check it,” he said.
The Steps:
Etherington pointed out that a limited number of variables can be easily changed in a data center: server load distribution within racks, server rack location and orientation within the space, air inlet/outlet locations, supply air velocities and temperature set points. When using CFD software to analyze a problem, typically a single variable is changed so the analyst can clearly identify the impact of a specific change.
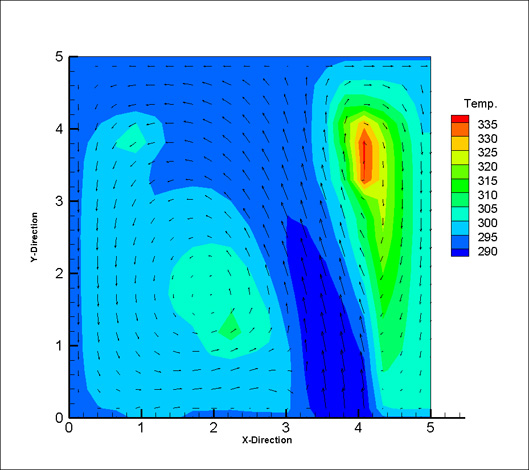
For the purposes of his study, Etherington compared two simplified data center configuration scenarios, using 2-dimensional analysis (Note: Tecplot also has 3-dimensional capabilities). Server load distribution and location were the variables altered for study. Etherington then used Tecplot to show the resulting temperature and velocity vector distributions.
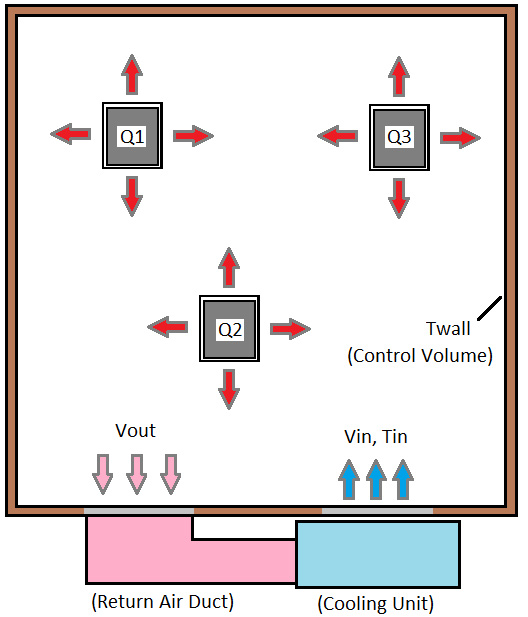
The first scenario represented a “typical” data center layout in which the facility manager is not educated on optimal equipment layouts and server load distribution. The servers were randomly placed throughout the data center with little thought to how placement affects temperature and flow conditions.

Typical data center layout
Analysis of this model found a local maximum temperature of 335 K (~143 oF), an unacceptable level for data center optimization.

2D Temp. Plot w/ Vectors, Ideal Set-up
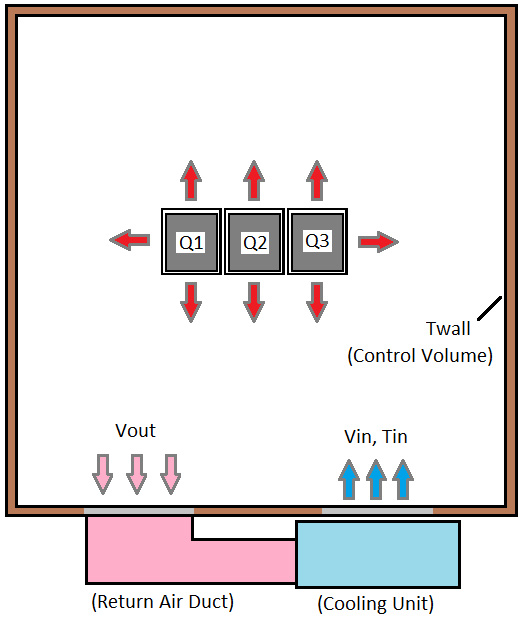
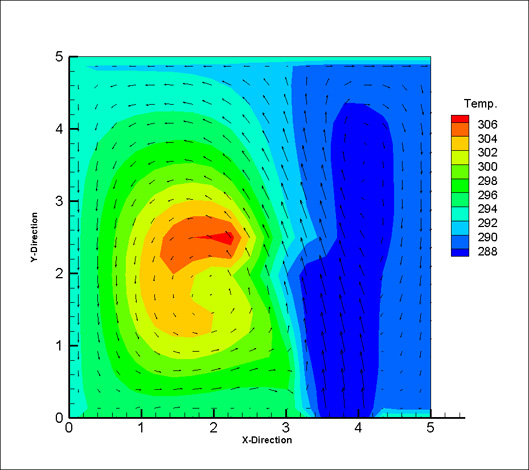
In the second scenario, an “idealized” model, Etherington altered server load distribution and location. The server racks were grouped together in this model, and each assigned a uniform heat generation, averaged from the previous scenario. Analysis of this model showed much more reasonable temperature ranges, with a local maximum temperature of 305 K (~89 oF).

Ideal data center layout
Etherington also used Tecplot to illustrate how even minor adjustments in equipment layouts can drastically change the temperature in a data center.

2D Temp Plot w/ Vectors, Ideal Set-up
Conclusions
Etherington achieved his goal of developing a basic code for scenario-based modeling utilizing FORTRAN. He found Tecplot “extremely valuable” in this process. Data was outputted from the FORTRAN code in text format, with the specific variables separated and appropriately labeled. Once the text file was generated, Etherington opened it up in the Tecplot software.
“The most helpful thing with Tecplot was that it helped verify my code,” he said. “I wrote the code, and then was able to visualize it rapidly and quickly compare multiple scenarios. It helped me picture what was happening, to compare the two scenarios I was studying.” Although a CFD analysis is intended to provide estimates on flow and temperature conditions, these estimates can be used to make early stage observations and identify potential problems before they occur.
“This information would prove to be very useful to consulting engineers interested in conducting preliminary optimization or design validation studies,” he noted. He also recommended that future projects performing 3-dimensional analysis be performed for more complex layouts or cooling systems.


