Today’s low-cost computational resources have fundamentally changed the way we approach modern technical challenges. In the world of CFD, one of the most dramatic changes has been the increasing use of unsteady (transient) simulations, which allows engineers and scientists to study moving machinery and turbulence flows more effectively.
This article is designed to show you how to work more easily with unsteady results using the improved quantitative capabilities in the latest version of Tecplot 360. For the purposes of demonstration, we will show you how to optimize the blade of a vertical wind turbine.
- The image below, shown in Tecplot 360, is a view from the top of a Darrieus wind turbine showing pressure on the blades as they rotate with the wind.
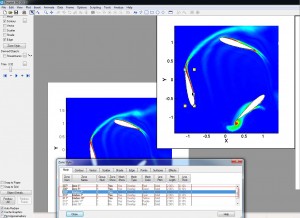
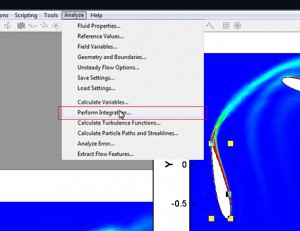
- In the Analyze menu, select Perform Integration.
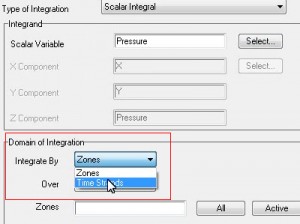
- Click on the Select button for Scalar Variable and chose Pressure in the pop-up.
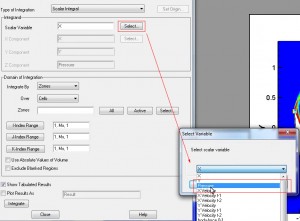
- Select Time Strands from drop down menu under Integrate By.
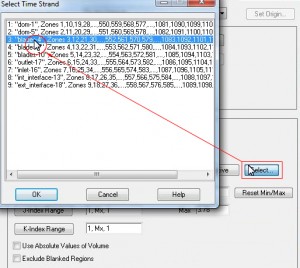
- From the Time Strands field, select the zone(s) you want to integrate.
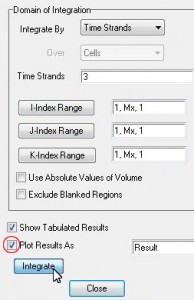
- With Plot Results As checked, select Integrate. Tecplot 360 will then integrate the pressures on the blade for each individual time step.
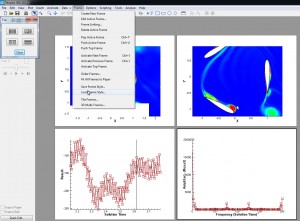
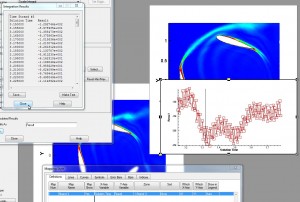
- The results can be aggregated into a plot like this, which shows the integrated pressure on the blade as a function of solution time.
- You also can examine the periodic nature of your data using the Fourier Transform feature. This example shows how to determine whether there are any harmonics by looking at the frequency domain.
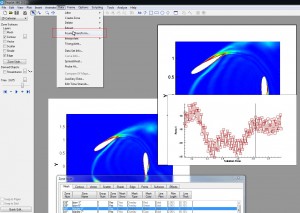
- The comparison, in this case, is of the independent variable of solution time versus result for the strand that we have. The resulting new graph shows the frequency domain.
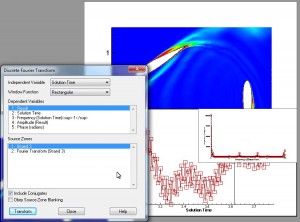
- By adjusting the frames, you can see the two potential wind turbines with the integrated results and the frequency domain. All of these results can then be exported to a final plot image.
