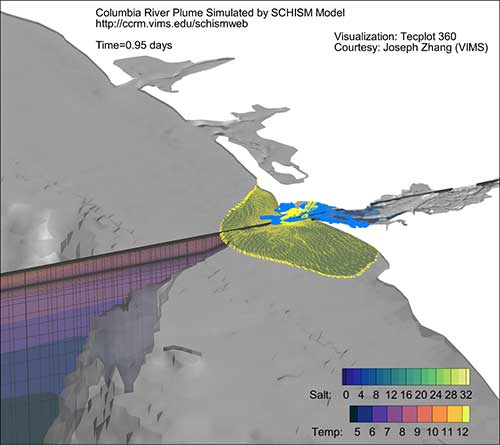
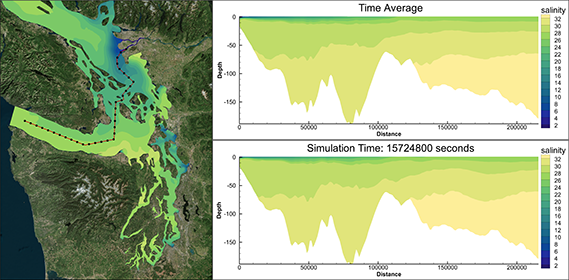
This blog answers 9 questions about visualizing ocean models with Tecplot 360. Asked in our Visualizing Ocean Models webinar, they are answered by Scott Fowler, Tecplot Product Manager, and Wen Long, Technical Product Manager.
Questions from the webinar “Visualizing Ocean Models”
1. Where can I get the Python scripts from this Webinar?
Python scripts from this webinar are now on GitHub.
2. How do I convert shapefiles to Tecplot PLT format?
Watch this short video tutorial on Converting Shapefiles to PLT Using PyTecplot.
3. Does Tecplot have loaders for other ocean and weather models, for example, ROMS, WRF and TELEMAC?
Tecplot ROMS, WRF and Telemac loaders are still in beta. To try these loaders out, contact support@tecplot.com.
If you are working with other models, many export netCDF format. NetCDF is a very flexible format, which makes it difficult to support in a generic way. As we develop capabilities for the geoscience community, we will prioritize based on interest and requests. We found that FVCOM had the largest set of support base so far.
If you are using codes like ADCIRC, ROMS, TELEMAC, please let us know and we’ll make sure to put that into our priorities.
But we do have the TecIO Library, we do have PyTecplot, and you can even use MATLAB® to convert data to Tecplot format.
4. Can Tecplot plot differences between two different outputs for the same area as contours?
If you have two different datasets, the Tecplot equation syntax allows you to compute differences between datasets. We can certainly help you out with that and show you how to do that. Watch these videos on comparing grids from two different outputs.
5. Do you have a complete user’s manual?
Yes, of course. Tecplot has been in development for nearly 30 years now, so we do have an extensive user’s manual and very good documentation for the Python APIs. Get the Documentation.
6. Which FVCOM version does Tecplot work with?
Tecplot supports FVCOM version 2.7.1 to the most current FVCOM 3.2. I believe most of the versions are supported as long as you have the netCDF output from them.
7. In addition to existing frames from FVCOM netCDF file, how can I add another frame showing a wind vector which changes by time?
Tecplot has a multi-frame layout. Whether your data is coming from the same dataset or a different dataset, you can simply create another frame, attach your dataset to it and show wind vectors.
You can load multiple datasets into Tecplot 360 simultaneously and link those frames in time. If they have the same time steps, it’s no problem.
8. Can Tecplot be run on an HPC through client server mode?
The answer is no. We can’t run on an HPC, but you do have to be logged into the head node. Tecplot 360 is not a multi-node, parallel application. We found that we haven’t needed it because Tecplot’s memory and data I/O management is so efficient. Our customers have not had a need to run Tecplot in a distributed mode.
I encourage you to try Tecplot 360. If you do have issues with the size of your dataset, let us know and we’ll work with you to come up with a solution.
If you do have your data on the remote server and you are running Tecplot 360 on your desktop, you can actually access the data remotely.
9. Is there an easy way to show two vector datasets, for example, surface velocity and mid-depth velocity?
Tecplot can plot only vectors of one set of vector components at a time in a single frame. If you have just one set of vector components, you could plot an isosurface at the surface and another isosurface at mid-depth. Then those would overlap and you could see those simultaneously.
If you have two different sets of vector variables, there is a way to do it using two overlaid Tecplot frames, with one frame being translucent. If you want to see of that, we can certainly work with you on that (again, contact technical support).
Request a Quote
We have favorable pricing for qualified academics in the US and Canada – Request an Academic Quote.
For the commercial and government sectors – Request a Quote.
Try Tecplot 360 for Free
Your trial starts from the first time that you start Tecplot 360. So, if you download it and get distracted, not to worry. The five-day trial will start after you install and start running the trial.
During those five days, you have access to our technical support team. We can help you load your data and create and manipulate plots, even help develop some Python scripts for advanced analysis.
Please take advantage of the free trial and compare it to your existing workflow. I think you’ll be really excited and happy with the results.


