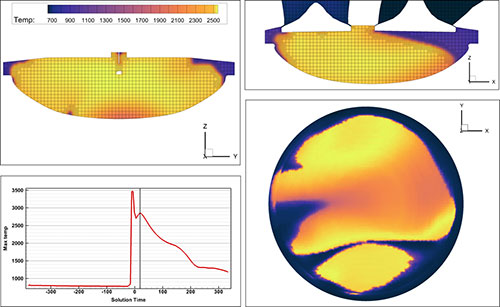
This blog answers 9 questions about Tecplot for CONVERGE. Asked in our Getting Started with Tecplot for CONVERGE webinar, they are answered by Scott Fowler, Tecplot Product Manager, and Tiffany Cook, Partner and Public Relations Manager, Convergent Science.
Questions from the Webinar “Getting Started with Tecplot for CONVERGE”
How do I add macros without admin rights?
If you do not have read-write access to the tecplot.mcr file in the installation directory, Tecplot 360 can be started with a custom tecplot.mcr. Create your own tecplot.mcr file and run Tecplot with the –qm flag. For example, tec360.exe –qm C:\Desktop\tecplot.mcr.
Is it possible to automate with Python and Tecplot?
Yes. The Python API, PyTecplot, can do anything that Tecplot 360 can do and more. PyTecplot can be used with additional packages to increase the computation power and customizability.
PyTecplot is used for:
- Automating workflows that use multiple engineering tools.
- Performing detailed calculations on all your CFD data sets.
- Accessing CFD data directly for custom analysis.
- Reading any data type.
- Extracting values, figures and animations directly from CFD data sets.
- Connecting Tecplot 360 to other tools and processes.
Is it possible to create a routine to evaluate SMD (Sauter mean diameter) at a specific plane?
Possibly. When we showed the mass flow rate calculation, that dialog is created using Tecplot 360’s public API. Tecplot for CONVERGE does have access to our public API, the Tecplot ADK. The documentation for that is available on our website. That documentation is a little bit on the dated side. So, if you are interested in writing some special routines, please contact us. Through those APIs you do have access to the raw data of your simulation as it’s loaded into Tecplot 360. So, you can do all sorts of interesting things with that API.
How do I save a context file for reuse in future cases?
That would mean saving your layout, your style sheet, or your macros. Layouts, style sheets and macros are plain text, all of which can be saved and easily modified for future use.
How do I perform an FFT on CONVERGE data?
Using line plots, you can right click on the line that you want to compute the FFT to bring up the context menu. There is an option on the context menu called Fourier Transform and it will perform the FFT. This option can also be found by selecting Fourier Transform under the Data menu.
Are some of the macros shown in the demo available for users?
Yes. Convergent Science has made some of these macros available on their download site. If you log in to the download site, you can download Tecplot for CONVERGE, a set of macros and the Python UI used in the Webinar.
How can I create arrow vectors for part of the solution?
To create vectors or arrows on a slice, click the Vector page from the Slice Details dialog. Select Show vectors, and make sure the vector variables are set properly. You can similarly show vectors on an iso-surface. You can also toggle on Vector for the zones.
Is split window available?
No, we don’t have a split window mode. Instead we have multiple frames and multiple pages. Frames can be ordered via the menu bar.
I’m using CONVERGE through Rescale, can I get Tecplot for CONVERGE?
Yes. We have worked with Rescale to provide Tecplot for CONVERGE on the Rescale platform.


