


 MENU
MENUYou asked some great questions in the Webinar on getting started with Tecplot 360. Answers are in this blog along with links to more detailed information.
User manuals, installation, getting started, scripting and quick reference guides can be found in our Tecplot Product Documentation.
1. How can I use LaTeX labels in plots?
Watch the Video Tutorial on LaTeX Fonts
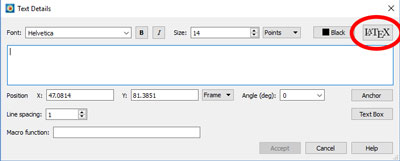
You can add LaTeX labels to your plot by clicking the text tool ![]() and then clicking inside your plot. This will open the Text Details… dialog. Select the LaTeX button at the top right of the Text Details… dialog.
and then clicking inside your plot. This will open the Text Details… dialog. Select the LaTeX button at the top right of the Text Details… dialog.
The LaTeX capability uses the LaTeX engine installed on your machine so it will use the same processes that you are familiar with in other applications.
2. How do I make a slice perpendicular to a surface, if the surface is not aligned with the X, Y or Z axes?
For more detailed information, see the Arbitrary Slice Orientation section in the Tecplot 360 User Manual
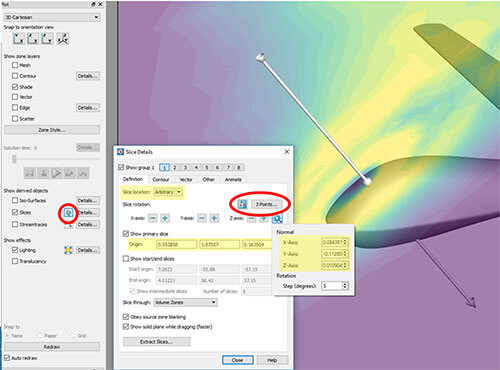
There are three ways to do this. Turn on slices by checking Slices in the Plot sidebar.
- The first way to add a perpendicular slice is by using the Slice tool. Open the Slice Details… dialog and set the Slice location to Arbitrary. The arrow will be displayed on the screen, which then can be interacted with.
- The second way is to open the 3 Points… dialog (in the Slice Details… dialog) and click three locations on your plot. Tecplot 360 will set the slice to go through those three points (although not perpendicular, it can be useful).
- The third way is to paste the origin and normal directly into the Slice Details… dialog, if you have those values.
For more detailed information, search for the Arbitrary Slice Orientation section in the Tecplot 360 User Manual
3. Can I change the default startup settings?
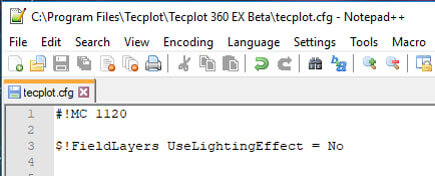
Many Tecplot 360 startup settings can be set by default. They can be changed by editing the config file (tecplot.cfg) located in your installation directory. Tecplot reads and executes commands in the config file on startup. As a result, adding or editing macro commands in the config file will change the default settings.
For more detailed information, see the Customization section in the Tecplot 360 User Manual.
Contours, however, cannot be turned on by default. This is because contours are dependent on the data. However, you can use a quick macro to change the contours setting once you have loaded your data. And this is the case with all data-dependent values – that you will need to change them after your data is loaded.
The config file is seeded with many, many settings. Often, you will just need to remove or add a comment to switch between defaults.
For more detailed information, search for the Customization section in the Tecplot 360 User Manual.
4. How can I use Python with Tecplot 360 to automate the data analysis process?
PyTecplot, our Python API, has the capability to control an interactive instance of Tecplot 360 directly from Python. You can record a Python script and then connect to a live Tecplot 360 instance. To do this select Record PyTecplot from the Scripting menu. This will seed and create a Python script that can be run either in batch mode or connect mode in Tecplot 360. More information can be found on the PyTecplot page.
Video: PyTecplot Recording and Connections
5. Is there any way that I can turn on the accept Python connections by default?
Python requires a socket connection to communicate, so you can use your favorite IDE or command line script with Python. This means that you have to turn on listening on the Tecplot 360 side before you can communicate. To do this by default, run Tecplot 360 with a macro on the command line that includes a command to start listening. The command is tecplot.session.connect().
6. Can I limit the slices to go through just volume zones?
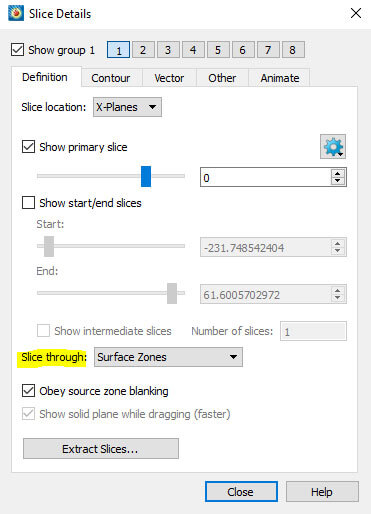
Yes. The Tecplot 360 default setting has slices going through only volume zones. To have slices go through surfaces zones, open the Slice Details… dialog. Set Slice through: to Surface Zones.
7. How do I create iso-surfaces through a 2D PIV data?
I think the answer here is not iso-surfaces so much as contouring. We have partnerships with PIV vendors LaVision, Dantec Dynamics, TSI, and those write out Tecplot format directly. You should be able to import your data quite easily and do post processing activities. If you are not with one of those vendors, your data is usually going to be structured. You may have a grid in say, XY dimensions and you could bring that into Tecplot as a IJ-ordered data set. If you need help with doing this, please contact our technical support team at support@tecplot.com.
8. How can I draw a slice only near the cylinder?
In the case of flow around the cylinder, use Value Blanking to constrain the slice to a smaller region. Select Value Blanking from the Plot menu. Then constrain the x and y dimensions. That will effectively reduce the size of the slice.
It will reduce the number of volume cells that you are displaying as well. This is where data extractions are very useful. You can extract the slice and then turn Value Blanking off and see the full extent of your domain.
Watch these video tutorials on Value Blanking.
- Computing Iso-volumes Using Value Blanking
- Isolating Particles with Value Blanking
- Calculating Mass Flow Rate
- Identifying regions of maximum stress in an FEA solution
- See the Customization section in the Tecplot 360 User Manual
9. Is it possible to add CAD geometry to my data sets?
Yes. Tecplot 360 can load standard CAD file types, and they can be loaded at the same time as simulation data. See page 2 of our Datasheet (PDF).
10. I usually have cylindrical coordinates. Can I create a surface of revolution at a radial location?
There are a couple of things to consider here. Number one, you have the ability to transform coordinates in Tecplot 360 via our macro language. Coordinates can be transformed between Cartesian and cylindrical. If you have a radius variable, you could define an iso-surface based on that radius variable to get something that looks cylindrical.
For more information, search for “transform” in the Tecplot 360 Scripting Guide.
11. How do I integrate MATLAB® post processing with Tecplot 360?
The best way to integrate MATLAB is to export your data from MATLAB into a Tecplot-readable format, and then read it into Tecplot 360. Similarly, export your data from Tecplot 360 into a MATLAB-readable format, then read it into MATLAB.
12. How would I show visualization for a steady case file?
At each individual time step, a steady state is showing on the screen at any time. If you have a steady state solution, you will have all the same visualizations options in Tecplot 360.