


 MENU
MENUAdvances in reservoir simulation have given engineers a more accurate electronic representation of reservoir structure and fluid behavior. However, more meaning must be extracted from post-simulation workflows to fully understand important information such as well path trends throughout the model.
The 2019 R1 version of Tecplot RS introduces a new Well Path analysis workflow. The powerful operations in this workflow can be accessed through a very simple interface that helps you get to your solution quickly and easily. To help you understand the new Well Path capability, I’ll walk you through a real-world example.
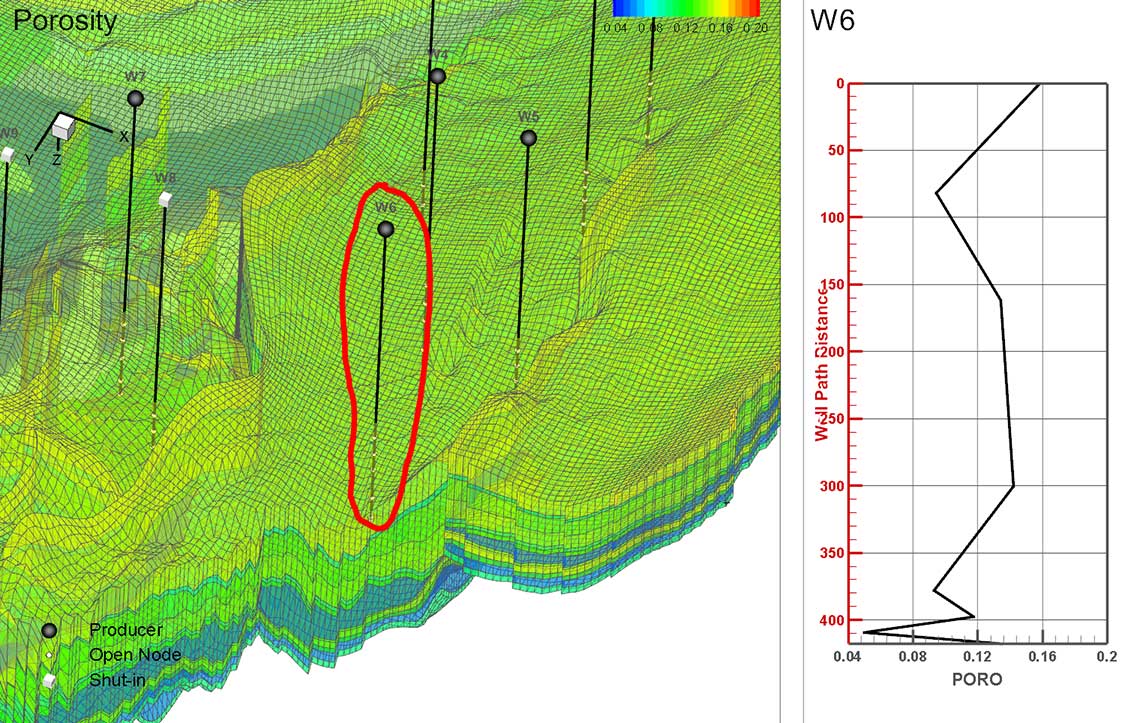
Figure 1. Tecplot RS Well Path probe follows the well path and presents the user with the property values in the quick frame. Click image for higher resolution. Watch the Video Tutorial »
Analyzing Well Path Trends
In the Johansen model, Figure 1, I want to understand the reservoir properties along the paths of the existing wells. I may want to investigate the grid property values such as pressure, temperature, permeability or porosity trends.
In this example, I want to see how porosity is changing along the well path W6, see Figure 1. Using the Well Path probe in Tecplot RS, I can simply probe at the well W6, and the XY plot appears in the quick frame showing me porosity vs. well path distance.
Well W6 is completely vertical, but the operation of the Well Path probe works with horizontal or deviated wells.
In other words, Tecplot RS simply follows the well path and presents the user with the property values in the quick frame.
Understanding Reservoir Properties
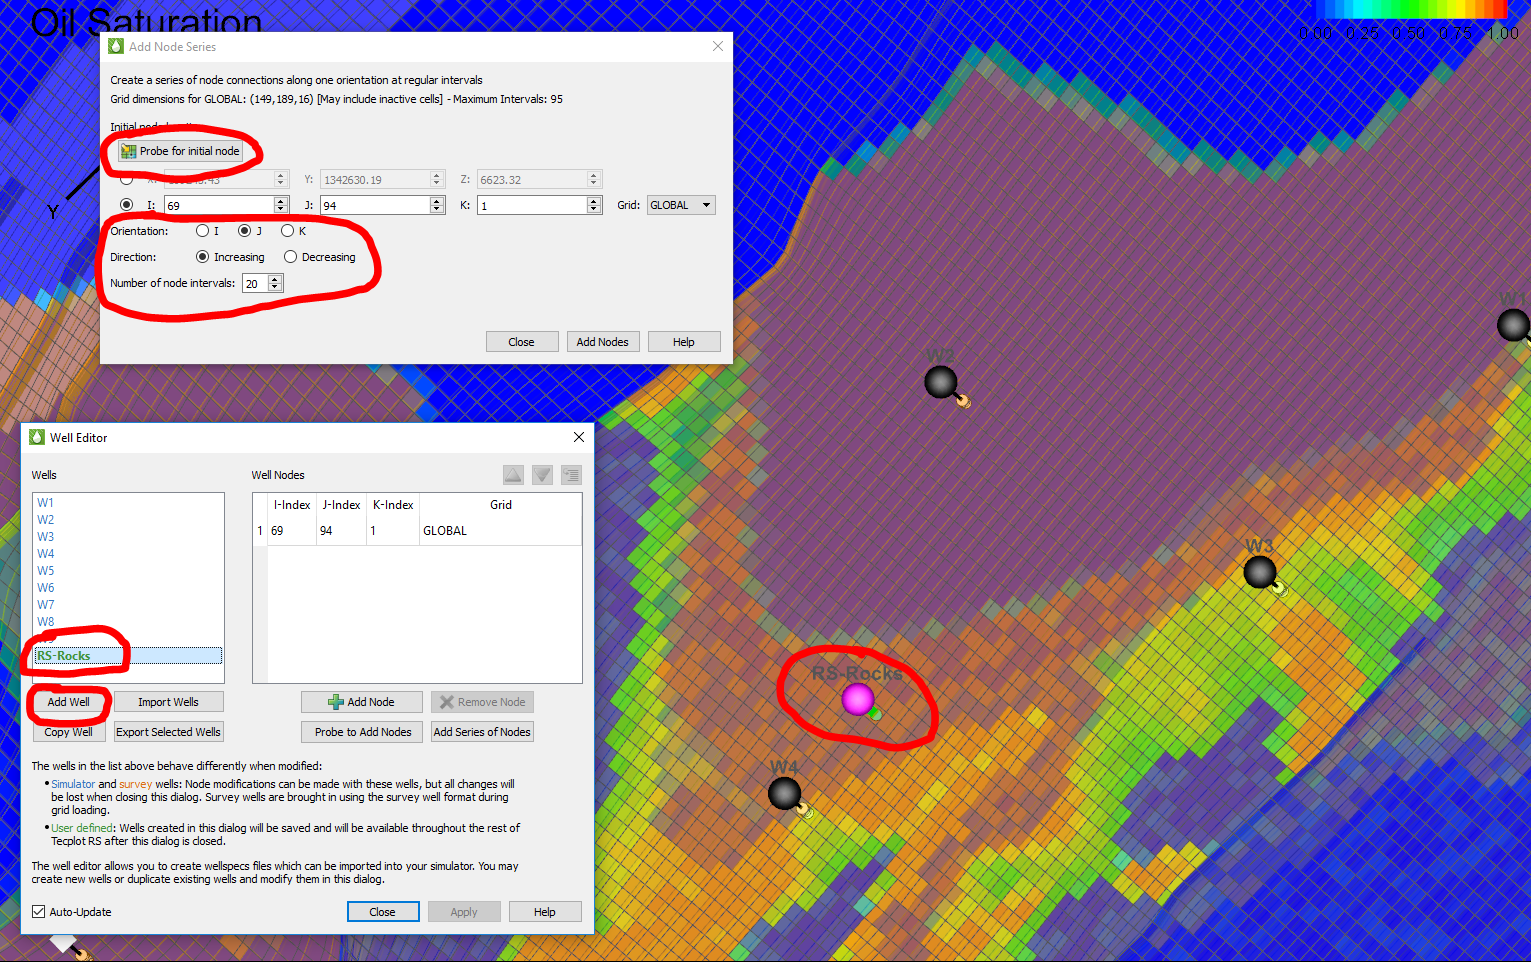
Figure 2. Understand reservoir properties along any arbitrary path. Click image for higher resolution. Watch the Video Tutorial »
The Well Path analysis above gave me an understanding of the grid property trends along the simulated well path. Now I want to understand the reservoir properties along any arbitrary path.
I can create a new well from scratch using the Well Editor in Tecplot RS. I want the new well to be horizontal and to be in the positive j direction.
Using the Add Node Series dialog, I can easily create the new well. First Probe at a cell to define where to start the new well. And second, specify the other details. For example, orientation (j), direction (increasing), and number of node intervals (20). I have called the new well RS-Rocks, see Figure 2.
Analyzing Well Path Trends

Figure 3. Analyze trends along a newly created well path using the Well Path probe. Click image for higher resolution. Watch the Video Tutorial »
Now that my new well has been created, I want to analyze the trends along this new path. Using the Well Path probe, I can see how the oil saturation (SOIL) is changing along that horizontal path. See Figure 3.
I can continue with this workflow to understand the other property trends along this path. Seeing how the oil saturation, water saturation, pressure or transmissibility is changing along the path of the RS-Rocks well gives me a deeper understanding of the reservoir.
In conclusion, the Well Path workflow is a powerful and useful tool for reservoir engineers – getting you to solutions quickly. You can use it to understand and present potential drilling locations, or to simply understand property trends of a chosen path.
Try these features out, and please let me know how it is working for you. If you have any questions or comments, call me at 425-653-1200 or email sales@tecplot.com.
Happy Tecplotting!
Raja Olimuthu, Tecplot RS Product Manager.