


 MENU
MENUThese questions were asked during the Webinar, From Zero to Hero: Tecplot 360 Basics. Tecplot 360 Product Manager, Scott Fowler, provides the answers below. Most of the answers show Webinar timestamps so that you can follow along in the Webinar. Learn more about Tecplot 360.
1. How do you save all the steps to a macro?
The steps taken in the Webinar (timestamp 36:55) can be recorded to a macro file. Macros are the legacy scripting language of Tecplot 360, and the language on which many of our file formats are based.
- You can customize the Tecplot 360 user interface using the quick macro panel.
- You can customize defaults using what we call a configuration file, tecplot.cfg.
- You can save your current work by saving to a layout file. If you have created new variables, you will also be asked to save the data file. The saved layout file is in this macro language.
Tecplot 360 also has a Python API, called PyTecplot, which is available to customers on TecPLUS maintenance. Learn more about PyTecplot.
2. Why is the cylinder surface not showing velocity magnitude?
The cylinder in the Webinar example (timestamp 38:07) is a no-slip wall. Because it is a boundary condition, there are no velocities on the wall. If I want to see the velocities near the wall, I could change J planes to, for example, J=2.
3. Can we plot stagnation energy?
Yes. That is a variable that can be computed. From the main menu (Webinar timestamp 38:46), select Analyze>Calculate Variables and click Select…, then choose Stagnation Energy. See Section 21-3.2 Identifying State Variables in the Tecplot 360 User’s Manual.
4. How do I export a figure without a borderline?
You can hide the border by editing the active frame. To edit a frame (Webinar timestamp 36:55), right-click on the edge of your frame, then choose Edit Active Frame. Uncheck Show border.
Some graphics cards will have a little drop shadow on the right and bottom of plots. This is graphics card dependent. If you see a drop shadow after turning off borders, please see this article on how to correct it in the Tecplot Knowledge Base.
5. When I save a layout and move the layout to another folder, it won’t load.
When you use the menu command File>Save Layout As, there is a toggle (under the Save as type) that says Use relative paths (Webinar timestamp 36:55).
- Checking the toggle saves the referenced data layout file as a relative path.
- Unchecking the toggle saves the layout file as an absolute path. You should be able to load your data when it is saved as an absolute path.
You can also edit the layout file because they are saved as human readable macro files. (timestamp 39:50). I’ll quickly open a macro file and you can see what the Tecplot macro language looks like.
Here is the layout that I saved earlier. You can see that I have a command to point to linedata.plt. To move this file to a different folder, I need to change the file path to an absolute path. I can update the path in the macro file.
Relative paths are often used by people doing optimization studies when they have a folder hierarchy with, for example, Mach alpha sweep and data within each sub folder. Using a relative path, they can copy a single layout into each subfolder and load that data by relative path.
6. Can you repeat extracting the line plot?
Yes. Use Tools>Probe To Create Time Series Plot, then single click on the plot, and that will update the time series plot (Webinar timestamp 41:20). You can see that as I single click, the line plot updates through time.
For more on extracting, see the Tecplot 360 User’s Manual
7. Is it possible to export a cropped image?
Images cannot be cropped in the traditional sense. However, selecting File>Export from the main menu gives you some options (Webinar timestamp 41:53). You can export three different regions of your plot:
- All frames – Exports all frames in your workspace.
- Current frame – Exports only the current frame.
- Work area – Exports entire “gray” region of your workspace.
To export only a portion of your image, you can do what we call a paper zoom. Zoom in on your plot by holding down the shift key, middle mouse button while moving the mouse up. A work area export will export the zoomed-in plot you see in the work area.
8. How can I get two plots in the same frame?
In XY line plots you can plot up to five X-axes and up to five Y-axes (Webinar timestamp 41:20).
In this case we’ll use multiple Y-axes. In the line plot, go into the Mapping Style dialog from the Plot sidebar, and you will see that there are multiple Y axes. For this example, select RHO and Velocity Magnitude to plot in the same frame, then press CNTL+F to fit the view. You can see that these have two very different scales. In the Mapping Style dialog, set RHO to Y2, and now row is on the Y2 axis.
This will give you two plots in the same frame. Select the adjuster tool![]() to move the label.
to move the label.
9. Can I add LaTeX symbols to the legend?
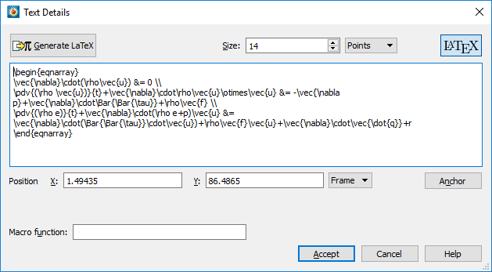
You cannot use LaTeX symbols in a legend, but you can add LaTeX annotation to your plot and position it near the legend (Webinar timestamp 47:16). Here is how to do that:
- Select the text tool
 .
. - On your plot, click where you want to position the text, which brings up the Text Details dialog.
- Press the LaTeX button (upper right side of Text Details dialog).
- Add the LaTeX annotation, set the Size in points, and press Accept.
- Click on the legend, which brings up the contour & Multi-Coloring Details dialog.
- Toggle off Show header.
- Click on the Legend Box… and click No Box.
- Close the dialog.
- Click on your LaTeX annotation and move it above the legend.
That will mimic adding LaTeX symbols to the legend.
Watch the Video on LaTeX Fonts
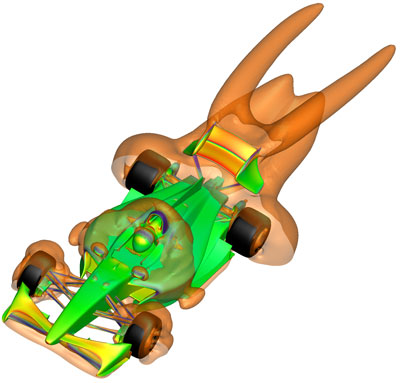
10. What is the Shade used for?
In 3D plots, zone effects (translucency and lighting) cause color variation (shading) throughout the zone(s). Shading can also help you discern the shape of the plot. To add shading to your plot, toggle-on Shade in the Plot sidebar. Use the Shade page of the Zone Style dialog to customize shading.
For information on translucency and lighting zone effects refer to Chapter 13, and for information on shade, refer to section 12-1 in the Tecplot 360 User’s Manual.
11. How do I perform a Fourier Transform?
In XY line plots, navigate to the Data>Fourier Transform… menu option. Follow along in this video for a demonstration: Loading Excel Data and FFT in Tecplot 360.