


 MENU
MENU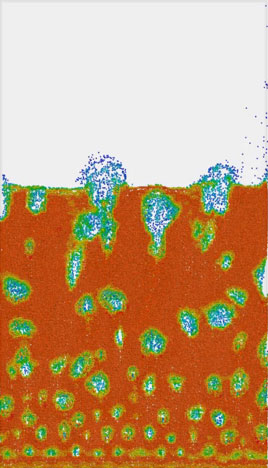
Bubbles in fluidized beds are (mostly) pockets of fluid traveling upward through the particle bed.
Specific features of Tecplot for Barracuda covered will include Extract Blanked Zones, Extract Connected Regions, and Perform Integration. We’ll demonstrate how to use these features directly within the Tecplot for Barracuda GUI, and also how to automate the process with PyTecplot (included with the full version of Tecplot 360).
Download the data Used in this webinar: cpfd.bubbles.data.zip
Webinar Agenda
- 0:01:27;00 – Overview of Tecplot, Inc.
- 0:03:34;00 – CPFD and Barracuda Virtual Reactor
- 0:04:26;21 – Introducing gas-particle fluidized bed systems
- 0:08:37;00 – Measuring bubble characteristics experimentally
- 0:13:54;10 – Extracting bubble characteristics from simulation results
- 0:15:47;20 – Extracting bubble characteristics in the Tecplot for Barracuda GUI
- 0:22:35;05 – Extract Blanked Zones
- 0:23:30;02 – Extract Connected Regions
- 0:25:45;23 – Perform Integration
- 0:26:47;28 – Automating and Extending the process with PyTecplot
- 0:32:59;00 – Q&A
Webinar Q&A
Webinar questions are answered by hosts Sam Clark, Tecplot for Barracuda Product Manager, and Scott Fowler, Tecplot 360 Product Manager.
If you calculate the total bubble volume using volume fraction, what would be the error relative to this method?
Sam Clark: I think the crux of this question is related to your grid resolution. In our demo the grid was relatively course. We wanted something that would run fast and would be easy for the purpose of illustration. But I think probably the limiter on your accuracy could be your cell size, and so just keep that in mind. When we’re looking at this volume fraction data, each cell in the Barracuda simulation has a single value for the particle volume fraction at any given point in time, so that’s really where your resolution will be limited.
Would it be possible to map a z location onto the bubbles?
Sam Clark: It’s often helpful to see how the bubbles grow versus height. I think it would be easy to grab the average z location on each bubble and record that as well.
Scott Fowler: The Integrate panel we used for computing the volume also can compute averages. A version of the script that Sam and I worked on earlier also computed average velocities. You could see the velocity of the bubbles, and Sam also took it a step further to put in an algorithm for computing a diameter of those bubbles. He saw that some of them were oblong, so not exactly circular, but you can make some assumptions about bubble shapes.
Can you provide the Python Script used in this demonstration?
Yes, and here is the link: cpfd.bubbles.data.zip
Do we have to create a 2D slice first to analyze bubble volumes with Tecplot?
Scott Fowler: And the answer is no. In the demo, we used the full volume cells for analyzing the bubble volumes. If you wanted to create a 2D slice first, you could, but in this case, we did it with the full volume cells.
Sam Clark: For most Virtual Reactor users, you’re probably modeling big three-dimensional systems that are maybe 10 meters in diameter and 20 meters tall. For the most part, you will be interested in bubbles that are inside the bed and are three-dimensional diameter or volume. That’s totally possible using the method that Scott showed in the demo. You would get the three-dimensional volume that the bubble occupies within the 3D space. Again, we used a 2D example for the sake of illustration.
Why did the particle volume fraction range from zero to 0.5 versus zero to one?
Sam Clark: This is a fundamental behavior of the way that particles pack. Most particles can only pack up to a fraction of about 0.6 and there’s always some gas space in between. And so that’s why even the highest red color on our volume fraction scale was probably around 0.6, rather than going all the way up to one, which would indicate a solid block of particles with no gas in between.
Can you make more than one variable per bubble at the same time? And if so, could you plot bubble velocity as a function of bubble size?
Sam Clark: Yes, you can do this. It’s like the previous question about attaching the z position or the elevation of the bubbles. Whatever information you’re interested in can generally be calculated through the PyTecplot script. So, if you wanted bubble velocity, bubble size, bubble z position, those sorts of things are possible to extract.
Scott Fowler: I think it’s also important to note that computing custom values, where Tecplot 360 doesn’t have a built-in capability, can be done with PyTecplot scripting. Sam came up with a heuristic for determining the bubble diameter and added that capability to the script.
If you can imagine it, you can pretty much do it. The Python layer really has opened up Tecplot 360 from being a visualization tool to a robust analysis tool. The connection with being able to access your raw data with Python, opens many interesting workflows, such as this one.
How do I get the add-on to separate the blank regions as separate zones?
Sam Clark: If you want this capability, you need to upgrade to Barracuda version 21.0.1, which we released in August 2021.
Scott Fowler: The extract connected regions capability was introduced as a macro function and Python function in Tecplot 360 2020 R2. It is not yet available in the user interface, but it is available in the scripting language.
What is the maximum number of clusters or smallest size of particles that we can do corresponding simulation by Barracuda? And what are the heating mechanisms in Barracuda? [40:58]
Sam Clark: This is a Barracuda Virtual Reactor capability question. In general, people model very, very large systems with Barracuda. There’s no limit on the number of real particles that you can model. Essentially Barracuda models particles as clouds of particles, so it groups them for the sake of the numerical method. With the latest GPU cards and the latest computers, people are running Barracuda models that might have something like 20 million to 30 million clouds. We’ve run simulations up to a hundred million clouds, but typically you would need a system with a lot of memory RAM and large GPU cards to do that. So, I would say something like 20 to 30 million clouds is not uncommon these days.
The smallest size of particles? Again, there’s no inherent limitation in the code, but most people are doing something like particles in the range of maybe 10-micron diameter to a thousand-micron diameter. That’s the most common range of particle sizes that people tend to be simulating.
Heating mechanisms implemented in Barracuda have conduction and convection between the particle phase and the gas phase, and then between the gas phase and any thermal walls. And then we also have some radiation models. If you’re running systems at very high temperature or with particles that are very different temperature than the surrounding fluid, those radiation models can be enabled in the software.
Scott Fowler: We have found that post-processing about 1 to 5 million particles tends to start taxing commercial grade graphics cards, especially if you’re using spheres as a way of representing those particles. We recommend using the point representation, especially when you have many particles. Sam, I believe Tecplot for Barracuda, you do that by default with some of those quick macros. Is that right?
Sam Clark: Yes, exactly. For quickly analyzing the results and getting those engineering conclusions, by default we render all the clouds or particles as points. And then if you want to make a really awesome looking animation, and you can afford the extra processing time, you can render them as spheres. But most of our analysis is done in the points view.
Is possible to carry out other type of non-uniform airflow distribution such as a spouted bed?
Yes, this is possible to do with Virtual Reactor, and a number of people have simulated spouted beds in the past.
Can bubble characteristics be extracted from simulation results of pressure fluctuations, is mesh size a limiting factor?
I don’t think you would be able to derive bubble characteristics from pressure fluctuation data alone, though perhaps there is some method I’m not familiar with that attempts to do this. Most people tend to deal with particle volume fraction data directly when calculating bubble sizes from simulation results. Mesh size is a limiting factor, for example, you cannot generally resolve bubbles that are smaller than the cell sizes in your model.
Talk about options for running in the Cloud.
Scott Fowler: Tecplot 360 can be run on cloud resources. When running on virtual machines (read: the cloud) we require access to a license server. To learn more you can read about setting up a post-processing environment on AWS.
It is also possible to run Virtual Reactor in the cloud. For example, see this case study.
Shape of the bubble? How does the vertical pierced length, measured by probes, compare with the CFD bubble diameter?
This is not something we’ve studied yet. However, it would be possible to simulate the data from optical probes by using data points in a Barracuda model, and compare those results with the bubble diameter results calculated from the Tecplot techniques discussed in this webinar.
Is it possible to incorporate particle shrinkage/breakage in solid-gas fluidized bed simulation?
Virtual Reactor has the capability of modeling changes in particle size due to chemistry, for example, particles can shrink if they are being consumed through chemistry or grow if a solid material is being deposited onto the particle through chemistry. We don’t currently have the capability of modeling particle breakage through impact, though.
How do I measure the following bubble parameters (fraction, diameter and velocity) in a gas fluidized bed using Tecplot for Barracuda?
Scott Fowler: In this demo we used Tecplot 360’s integration capability to compute the volume of the bubble, but you could also use integration to compute the average Z-velocity if that’s of interest.