


 MENU
MENU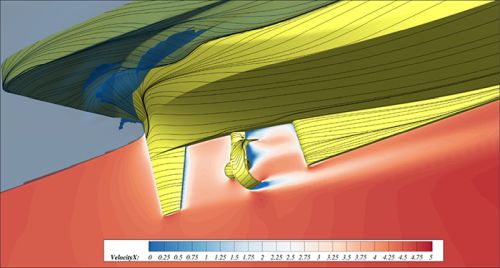
Try Tecplot 360 and PyTecplot for Free! Image courtesy of blueOASIS (case study).
Agenda
- Tecplot 360 with PyTecplot [0:0:57]
- Why use PyTecplot? [0:02:19]
- Customer Examples [0:04:10]
- PyTecplot Requirements & Installation [0:07:45]
- Running PyTecplot on the Command Line [0:10:44]
- Common Problems [0:14:49]
- Running PyTecplot: Batch vs Connected [0:19:19]
- Running PyTecplot: Jupyter Notebooks [0:25:40]
- Recording Scripts [0:47:09]
- PyTecplot Documentation & Resources [0:47:44]
- Q&A [0:50:00]
Tecplot 360 with PyTecplot
PyTecplot is the Python API to automate and analyze your data with Tecplot 360, our tool for data visualization.
Tecplot 360 is our flagship software and has long been trusted as a multi-purpose post-processor by engineers and scientists. 360’s clear visualization of complex data removes any doubt in your designs or analyses. It can create visually impressive 3D plots, and create 2D and XY plots for detailed engineering decision making. Large billion-cell datasets are efficiently handled to visualize your simulated or experimental data from multiple industry-standard data formats.
The built in CFD Analyzer toolkit also gives you the option of performing integrations, extracting key flow features such as vortex cores and shock surfaces, calculating new variables, and more, for additional analysis of your data.
PyTecplot allows you to automate 360 with the Python language. Use your own installation of 64-bit Python, install the PyTecplot Python API, and then create scripts that control an active session of Tecplot 360, or run in batch mode – which is especially useful if you want to incorporate this with other Python scripts as part of a larger workflow.
Why use PyTecplot?
Tecplot 360 is capable of powerful data analysis on its own and has a custom scripting language known as the Tecplot Macro Language. However, there is a benefit to using PyTecplot:
Automate your work in Tecplot 360 with Python, a widely used scripting language.
- Actions that are tedious in the Tecplot 360 user interface can be performed quickly with a PyTecplot Python script.
- For those who are new to Tecplot 360, the Tecplot Macro Language allows you to automate workflows as well, but rather than learning a scripting language specific to Tecplot 360 you can use Python, which is already used for many other tools and you may have as part of your workflow as well.
Directly access your data for analysis. Certain types of data analysis can be cumbersome, or not possible, in either the Tecplot 360 user interface or with the Tecplot Macro Language. Python libraries like NumPy or SciPy allow you to analyze and manipulate your data in ways that are not possible using only Tecplot 360: arrays, statistical analysis, and more.
Use your own installation of Python 64 bit.
Debug with Python IDEs. Tecplot 360 has a built-in debugger for the Tecplot Macro language, but with PyTecplot you can use your preferred Python IDE (Integrated Development Environment) to debug your script.
Customer Examples
- A Tight Cooperation Towards Ocean Sustainability by blueOASIS
- Analyzing Bubble Characteristics in Simulations of Fluidized Beds by CPFD Software
- Thermal Visualization of a Self-Sustaining Green House by MSOL, UC Berkeley
- Thermal Field Visualization for Uncertainty Quantification by MSOL, UC Berkeley
- Flow Dynamics of Liquid Jet Irrigation by CFD Research Group, RMIT University
- Tecplot Visualization Helps Understand the Carbon Cycle by UMCES, University of Maryland
PyTecplot Documentation & Resources
- PyTecplot Docs
- PyTecplot Video Tutorials & Webinars
- Getting Started with PyTecplot Scripting
- Blogs & Articles about PyTecplot
- PyTecplot Resources on GitHub
- Tecplot Technical Support
PyTecplot Script Examples on GitHub
- Minimum Pressure Location: MinimumPressureLocation.ipynb
- Hello World: 00_hello_world.py (also in the python examples folder within the Tecplot 360 installation directory)
- Timestep Delta: 05_timestep_delta.py
We highly recommend using PyTecplot if you want to get more out of your work with Tecplot 360, and to get to the answers that you need faster.