


 MENU
MENUDescription
In this video we’ll show you how to compute a vertical transect from FVCOM data using PyTecplot, our Python API (in Tecplot 360).
A vertical transect is a 2D plane that follows a prescribed path through the data and is projected vertically from the surface to the bottom.
We start with an FVCOM dataset already loaded. This dataset is of the Salish Sea, extending from British Columbia and down into Washington State.
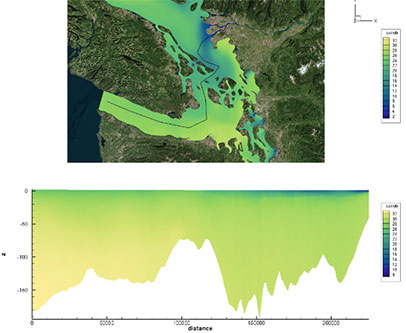
Vertical Transect of the Salish Sea using Tecplot 360.
Related Webinar
Define the Vertical Transect Path
First we need to define the path of the transect. To do this select the poly-line geometry tool. Using the geometry tool, click on locations to define the path of the transect.
Here we’ll define a path from the Straight of Juan de Fuca through the San Juan and Gulf islands, and up to the mouth of the Fraser River.
Extract the Points
Then right-click on the geometry to extract the points. This will create a new zone called “Extracted Points” which defines the XY coordinates to use for the transect.
Check the Grid Density
It is important to ensure that there are enough XY points to effectively capture the density of the grid. By turning on Scatter for the Extracted Points and turning on Mesh for the solution data we can see that the density of XY points is sufficient for our grid. Too many points are better than too few points, as you want to ensure you don’t skip over too many cells. This will result in a good continuous transect.
Invoke PyTecplot
Now that we have the XY points defined by the Extracted Points zone, we can invoke the PyTecplot script. To do this we must first allow PyTecplot Connections via Scripting -> PyTecplot Connections. Now you can run the VerticalTransect.py script from a command prompt. Using “python –O” will run the script in optimized mode, which will improve performance.
This script will connect to Tecplot 360, find the zone called Extracted Points and use the XY points to define a vertical surface zone through the volume, which defines the shape of the transect. The solution variables are then interpolated from the solution data onto the transect zone at each time step. This dataset has 24 timesteps with approximately 140,000 elements per timestep – this script should take about 15 seconds to run.
Animate Through Time
Now that we have the result, we can animate through time with the two frames linked together.
If you have a specific transect path, you can easily modify the script to supply a specific set of XY points.
This concludes the tutorial for computing a vertical transect in Tecplot 360.
Thank you for watching!