


 MENU
MENUTecplot 360 Basics Getting Started: Volume and Surface Zones
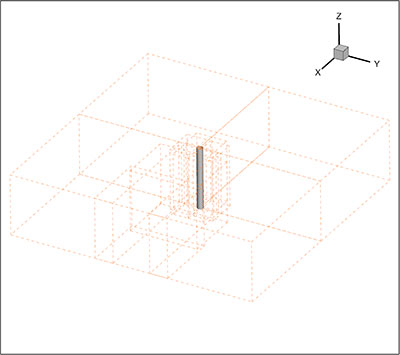
Tecplot 360 Bounding Boxes show volume zones that have no style.
This short video shows you how to view the extent of your data after it is loaded into Tecplot 360. Volume zones, bounding boxes, edges and surfaces to plot are covered.
Follow along by downloading and extracting the files from the Getting Started Bundle. The Bundle file contains data used in many of our video tutorials. This video uses the OversetCylinder.szplt dataset in the flowFlowOverCylinder folder.
Download the Getting Started Bundle
Volume Zones and Bounding Boxes
The orange dotted lines you see around the cylinder are called Bounding Boxes. Tecplot 360 displays Bounding Boxes in 3D plots for volume zones that are not being displayed because they have no style.
These bounding boxes may be turned off in the Options menu by unchecking Show Bounding Boxes for Enabled Zones with No Style.
Edges
To see the actual extent of your dataset, turn on edges by checking Edge in the Plot sidebar. You may need to zoom out to see the entire edge.
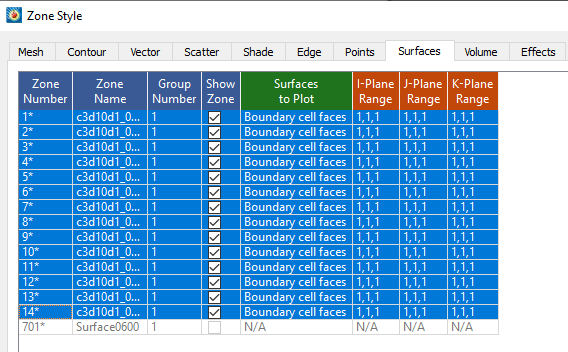
Select Boundary cell faces in Surfaces to Plot in the Zone Style dialog.
Surfaces to Plot
In order to see the exterior cells of your data, you want to show the boundary cell faces. Here is how to view surfaces on your plot.
Open the Zone Style dialog and select the Surfaces tab. The Zone Style dialog is available by either double-clicking on your plot, selecting the Zone Style button from the Plot sidebar, or selecting Plot > Zone Style from the Menu bar.
In the Surfaces tab, select the Zones of interest and right click to select Boundary cell faces.
More information can be found in Section 5-1, Creating Plots, in the Tecplot 360 User’s Manual.