


 MENU
MENU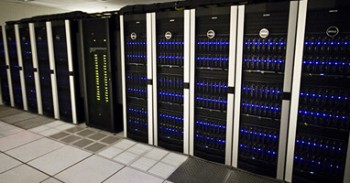 Turbulence is a complex process — and Jeff Chu is a graduate student who is eager to unravel the riddles of this common yet mysterious phenomenon. Conducting basic research at the University of Texas, Austin, Chu’s purpose is to closely look at flow structures to understand what causes turbulence to form.
Here are the steps he takes to untangle and understand the complicated phenomenon of the transition to turbulence.
Untangling the Transition to Turbulence
Step 1: Solve the Navier-Stokes equation
Chu defines his computational domain with a flat solid bottom wall with a small perturbation sticking out of the surface. Chu then uses an on-campus super computer to solve the Navier-Stokes equation. The computer produces ASCII outputs of 10 sets of data: X, Y, and Z (spatial variables); U, V, and W (velocity); ωx ,ωy ,ωz (vorticity); and λ2 (identifies the vortex structures in the flow).
Step 2: Convert ASCII output to binary
Since Tecplot can read binary data sets quicker than ASCII, Chu uses a Tecplot program called Preplot (that he downloaded free from Tecplot’s website) to convert the output while still on the supercomputer. He then transfers the binary data to his desktop workstation.
Step 3: Create the Video
One challenge Chu encounters is that the data sets are too big to handle efficiently on his 24-gig RAM workstation. To solve this problem, he created an elegant solution. “I create ‘snap shots’ one stop at a time and then chain them together into a ‘movie’. To do this efficiently, I created a macro using Tecplot Scripting Language.”
Chu used this approach to create his video. It shows the development of turbulent structures due to a protruding perturbation which causes formation of a turbulent wedge consisting of hairpin vortices and quasi-streamwise vortical structures. The figure is visualized by isosurface of λ2 colored by streamwise velocity.
Creating the macro. It took about 3 to 4 hours for Chu to learn the scripting language and write the macro. The macro now sequentially loads hundreds of data sets, puts in the right color bars and creates the right isosurfaces, and outputs the movie automatically. Here’s his process in detail:
- Chu loads the data sets and plots out the variables in Tecplot 360.
- He creates a frame style of what he wants to see and the colors he wants to use.
- Then he asks Tecplot 360 to automatically run through the data sets one at a time. The first data set is the 10 variables at time zero. The next set is a little after that, and so on. By sequentially linking these data sets, he can see hundreds of time snap shots chained together as a movie, as shown in the video. (Since this process can take tens of hours to complete, Chu usually runs it overnight.)
Step 4: Visualize the information.
To look at 3-D movies, Chu usually uses isosurfaces of λ2 so he can visualize vortical structures such as hairpin vortices.
Visualizing hairpin vortices. In this example, Chu asked Tecplot to color faster portions of the structures orange-to-red, and slower portions green. With that plotted, he could pick out the hairpins’ heads and legs.
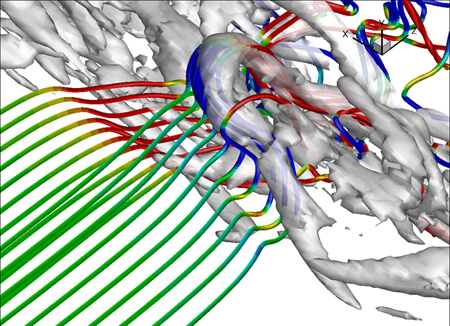
Zoomed in view of the fine scale turbulent structure. Vortex lines wrap around isosurfaces of λ2. The lines are colored by streamwise vorticity. This indicates the tilting of these vortex lines as they enter the turbulent wedge.
Why is this important? “It is essential to our research,” Chu explains, “to clearly see how the heads and legs interact. That’s because we think the legs are more important than the heads in spreading turbulence into the surrounding laminar flow.”
Plotting vorticity. For example, Chu can tell Tecplot to show positive vorticity as red and negative vorticity as blue. “That way I can see how different aspects of the flow structures are interacting with each other — or in other words, how can we make sense of what appears to be a complicated intertwining mess.”
Why is this important? “We think turbulence is generated by the turning of vorticity. By itself, streamwise vorticity is self-propagating, it spreads somewhat linearly. But we think that more turbulence is generated when streamwise vorticity turns spanwise vorticity.”
Step 5: Zoom into and around the details
“Turbulence is a very complicated process,” Chu explains. “We are hoping that by using Tecplot’s visualizations — and our intuition — we can come to understand what’s happening in fine detail.”
“We start with a hypothesis and then go into the data to see what’s there. We can either prove the hypothesis by seeing what is happening, or we can change a variable in the simulation itself to see the difference it makes. If it does make a difference, we can then assume it has a causal relationship to what we saw.”
Distribution of low-speed streaks within a turbulent wedge. The figure shows an iso-surface of streamwise velocity colored by distance from the bottom wall. Red area would indicate a low speed streak and a blue area indicates high speed region.
Chu uses Tecplot 360 to clearly see these miniscule structures and how they interact. He can move his camera around and look at the structures from different directions. He can roll the camera to the side to see what things look like from the side. He can see exactly how structures are positioned and tangled up together. “This ability to zoom in and roll around the turbulence is absolutely essential in understanding what’s really going on,” Chu says.
What they’ve discovered so far…
“We’ve been able to rule out a few things,” Chu says. “When you have a flow over any surface, the velocity at the surface goes to 0. One of the things we’ve found is that when we allowed spanwise slip below the spanwise turbulence, the turbulence may have increased from this condition. That tells us that spanwise no-slip is not an important factor in how a turbulence wedge is formed.”
“Understanding what is happening is one thing,” Chu says. “That’s what we’re working on now. Understanding why it happens will be a whole new, gigantic leap. And that’s where we’re hoping to go.”
Read more about this research for the Air Force on the Tecplot Blog >>