Tecplot at AIAA SciTech 2018

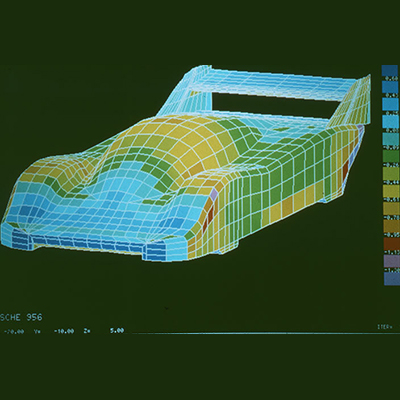
American Institute of Aeronautics and Astronautics (AIAA) Conference AIAA SciTech 2018 Join Tecplot at AIAA SciTech at the Gaylord Palms in Kissimmee, Florida, January 8-12. Tecplot engineers will be on hand to answer your questions and give you a 1-on-1 demo of the recently released Tecplot 360 2017 R3. The benefits of this release include support for LaTeX fonts, VTK data loader support for VTU and VTM file formats, recording […]

» Read More


Porsche 956

New Ways to Visualize Increasingly Complex and Unsteady Data

We are excited to take part in an industry that never rests and is never satisfied. Our engineers are eager to bring new ways to visualize increasingly complex and unsteady data, and provide new analysis features, while maintaining the Tecplot promises of giving engineers complete control over their output, fast post-processing speed, report-quality XY, 2D and 3D plots, and excellent stability, service and support. […]

» Read More


Tecplot 360 2017 Release 3 Extends Automation for Engineers

New Release Allows Python Script Recording and Playback in Tecplot 360 November 16, 2017, Bellevue, Washington: Tecplot, Inc. has announced the general availability of Tecplot 360 2017 Release 3. This release has added capability and improvements in several different areas. Highlights include: PyTecplot, Tecplot’s Python API, can be used to record Python scripts and play them back live in the Tecplot 360 interface. LaTeX fonts, a commonly used notation for […]

» Read More


5 Reservoir Simulation Analysis Questions about Tecplot RS Answered

Tecplot RS Product Manager, Raja Olimuthu, answers 5 common reservoir simulation analysis questions. We love it when you ask questions! Here are a handful of questions and answers about Tecplot RS, our reservoir simulation visualization & analysis tool for the oil & gas industry. During our site visits and support calls, customers often ask these common questions. It occurred to me that there are a lot more of you that […]

» Read More


Using the Loci-Chem Extract Utility to Create a Tecplot SZL File

By Tecplot’s Chief Technical Officer, Scott Imlay, PhD “In mathematics you don’t understand things. You just get used to them.” — Johann von Neumann I’ve written several blogs on Tecplot’s new SZL technology and how it speeds up the visualization of large CFD data sets by loading only those subzones (small chunks of data) that are needed for the desired visualization. We’ve demonstrated dramatic speed-ups for large data sets. For […]

» Read More


Recovery Maps and RESQML Data Loader Reduce Analysis Time

Customer-driven requests for one-click workflows and oil & gas industry data standardization BELLEVUE, Wash. (August 11, 2017) – Tecplot, Inc., developer of the leading visualization and analysis software for reservoir engineers, today announced the general availability of Tecplot RS 2017 Release 1. Recovery Maps The addition of Recovery Maps give engineers a one-click method to calculate and visualize the percentage change of any variable relative to initial conditions. With this […]

» Read More


Working with Unsteady Results

Today’s low-cost computational resources have fundamentally changed the way we approach modern technical challenges. In the world of CFD, one of the most dramatic changes has been the increasing use of unsteady (transient) simulations, which allows engineers and scientists to study moving machinery and turbulence flows more effectively. This article is designed to show you how to work more easily with unsteady results using the improved quantitative capabilities in the […]

» Read More


We put the “I” back in TecIO

TecIO Read Capability A blog by Dr. Scott Imlay, Tecplot’s Chief Technical Officer “Good things come to those who wait!” – Guinness beer advertisement For many years, TecIO has been a library of utility functions that allow you to output Tecplot binary files directly from your application. There are two versions of TecIO, one for serial output, and one for MPI-based parallel output. The serial-output version can output either classic […]

» Read More


Tecplot 360 2017 Release 2 Improves Power, Performance and Usability

New release has an enhanced Fluent loader, expanded PyTecplot APIs, improved SZL Server performance and integrated Q-Criterion calculation. BELLEVUE, Wash. (April 26, 2017) – Tecplot, Inc., developer of the leading visual data analysis software for engineers and scientists, today announced the general availability of Tecplot 360 2017 Release 2. Tecplot is committed to improving the power, performance, usability and reliability of its industry-leading flagship data visualization product. Many improvements in […]

» Read More


Tecplot SZL File Output from FUN3D

FUN3D version 13, released in September 2016, supports writing binary files in the new SZL format. I’ve written in previous blogs about the benefits of SZL technology for visualization of large data files. With SZL technology, common visualization tasks are up to two orders of magnitude faster and data files are compressed by up to 50%. This change offers additional benefits to FUN3D/Tecplot users, especially for those running in parallel on […]

» Read More