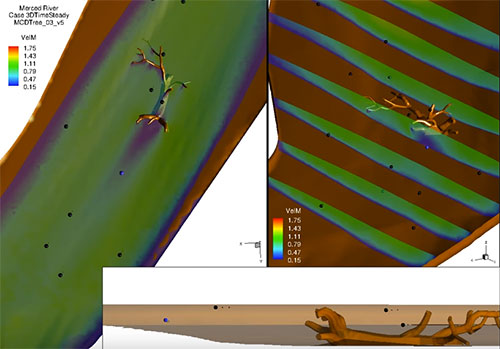
NASA Trap Wing

Comparison of Tecplot Data File Formats

Tecplot 360 performance has improved significantly in the last five years, however, the performance experienced by the user varies dramatically with the file format being read. Whenever we tell a developer that a customer is experiencing poor performance, their first question is always “What data format are they reading?”. I’m writing this blog to explain why. […]

» Read More


Sharing Data in Tecplot Files

Data Sharing in Tecplot Files

“Sharing is good, and with digital technology, sharing is easy.” –Richard Stallman. Tecplot divides datasets into zones. These zones may represent different areas of the physical domain, the same physical domain at different time steps, or different results that you may wish to compare. The zones may also have different dimensionality; for example there may be a mixture of 3D volume zones that contain field variables and 2D surface zones […]

» Read More


Tecplot for COMSOL Users

3 Reasons To Post Process COMSOL® Results in Tecplot

Having a reliable, accurate, flexible and easy-to-use method to post process your results is key to effectively analyzing CFD, other simulation and test data results. Tecplot 360 is a suite of CFD visualization and analysis tools that can handle large data sets, automate workflows and visualize parametric results. Load Simulation And Test Data From Many Different Sources If you aggregate data from multiple simulation sources, in addition to test data, […]

» Read More


Tecplot at AIAA SciTech 2018

American Institute of Aeronautics and Astronautics (AIAA) Conference AIAA SciTech 2018 Join Tecplot at AIAA SciTech at the Gaylord Palms in Kissimmee, Florida, January 8-12. Tecplot engineers will be on hand to answer your questions and give you a 1-on-1 demo of the recently released Tecplot 360 2017 R3. The benefits of this release include support for LaTeX fonts, VTK data loader support for VTU and VTM file formats, recording […]

» Read More


Porsche 956

New Ways to Visualize Increasingly Complex and Unsteady Data

We are excited to take part in an industry that never rests and is never satisfied. Our engineers are eager to bring new ways to visualize increasingly complex and unsteady data, and provide new analysis features, while maintaining the Tecplot promises of giving engineers complete control over their output, fast post-processing speed, report-quality XY, 2D and 3D plots, and excellent stability, service and support. […]

» Read More


Using the Loci-Chem Extract Utility to Create a Tecplot SZL File

By Tecplot’s Chief Technical Officer, Scott Imlay, PhD “In mathematics you don’t understand things. You just get used to them.” — Johann von Neumann I’ve written several blogs on Tecplot’s new SZL technology and how it speeds up the visualization of large CFD data sets by loading only those subzones (small chunks of data) that are needed for the desired visualization. We’ve demonstrated dramatic speed-ups for large data sets. For […]

» Read More