In the Tecplot RS 2023 R1 release, we introduce a new feature that will help reservoir simulation engineers expedite their history match workflows. The new History Match Workflow Module allows users to create selection sets based on the results of a history match quality assessment. This added functionality highlights two existing powerful features in RS: history match plot type and selection sets. The History Match Workflow Module bridges these features, which helps create a complete workflow. Let’s dive into this new functionality.
History Match Plot Type Overview
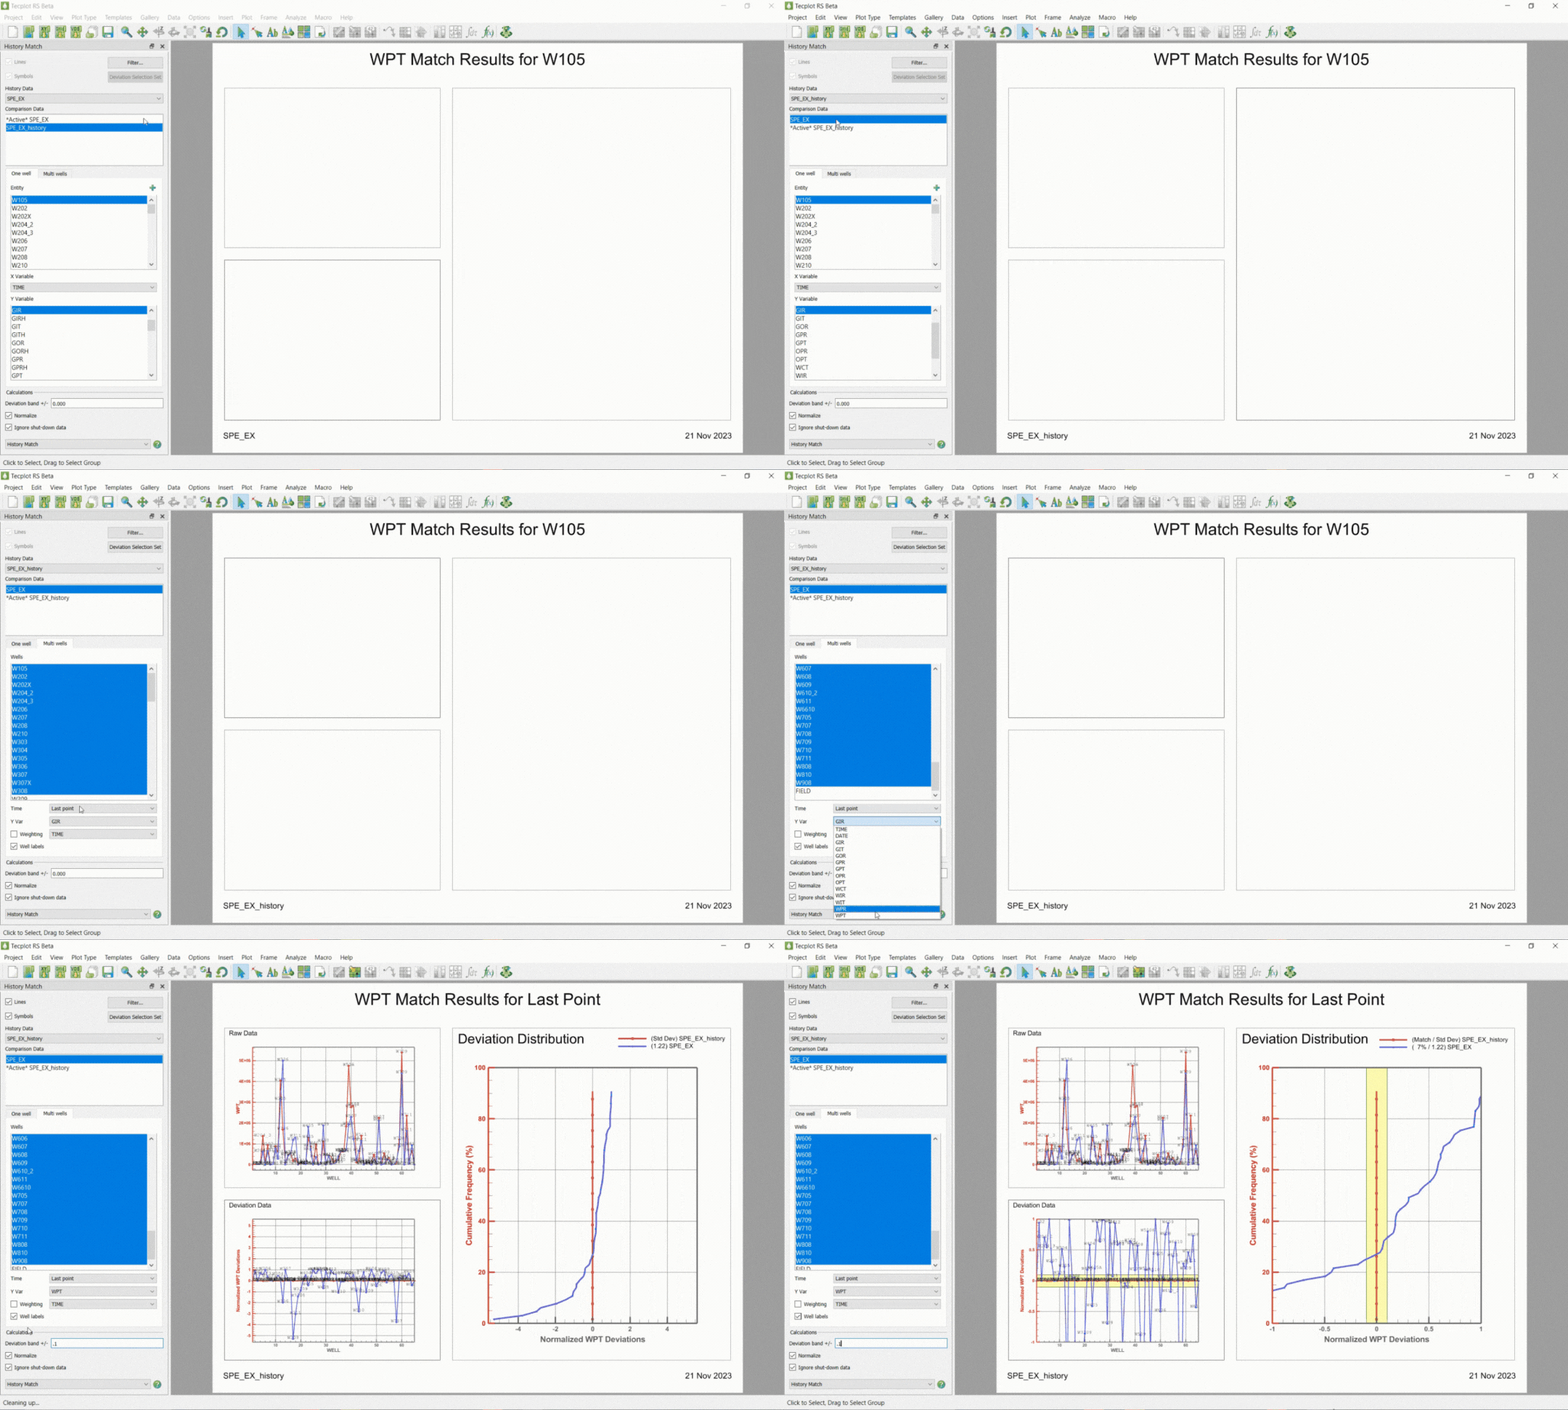
First, let’s get a refresher of this plot type (has been in Tecplot RS for many years). In the example case below (SPE_EX), we have a separate file, SPE_EX_history, which contains all the historical properties. To start a history match quality assessment, we’re going to make our selections on the sidebar. Here are the steps:
- Specify the history dataset – SPE_EX_history
- Specify the comparison dataset – SPE_EX
- Choose the entities you want to do an analysis on. In this case, I choose the Multi wells tab, and select all the wells
- Choose the variable you want to do the analysis on. In this case, I choose WPT – You’ll see the plots displayed now. The 2 plots on the left-hand side contain the raw data. On the right, the data is constructed into a deviation distribution plot
- Set a deviation band – this helps you understand the quality of the history match. In this case, I’m going to activate the normalize checkbox, and enter in a band of .1 – The results can be understood as –> 7% of the selected entities fall within a 10% tolerance band – for the last point of WPT

The New History Match Workflow Module – Now Available in Tecplot RS 2023 R1
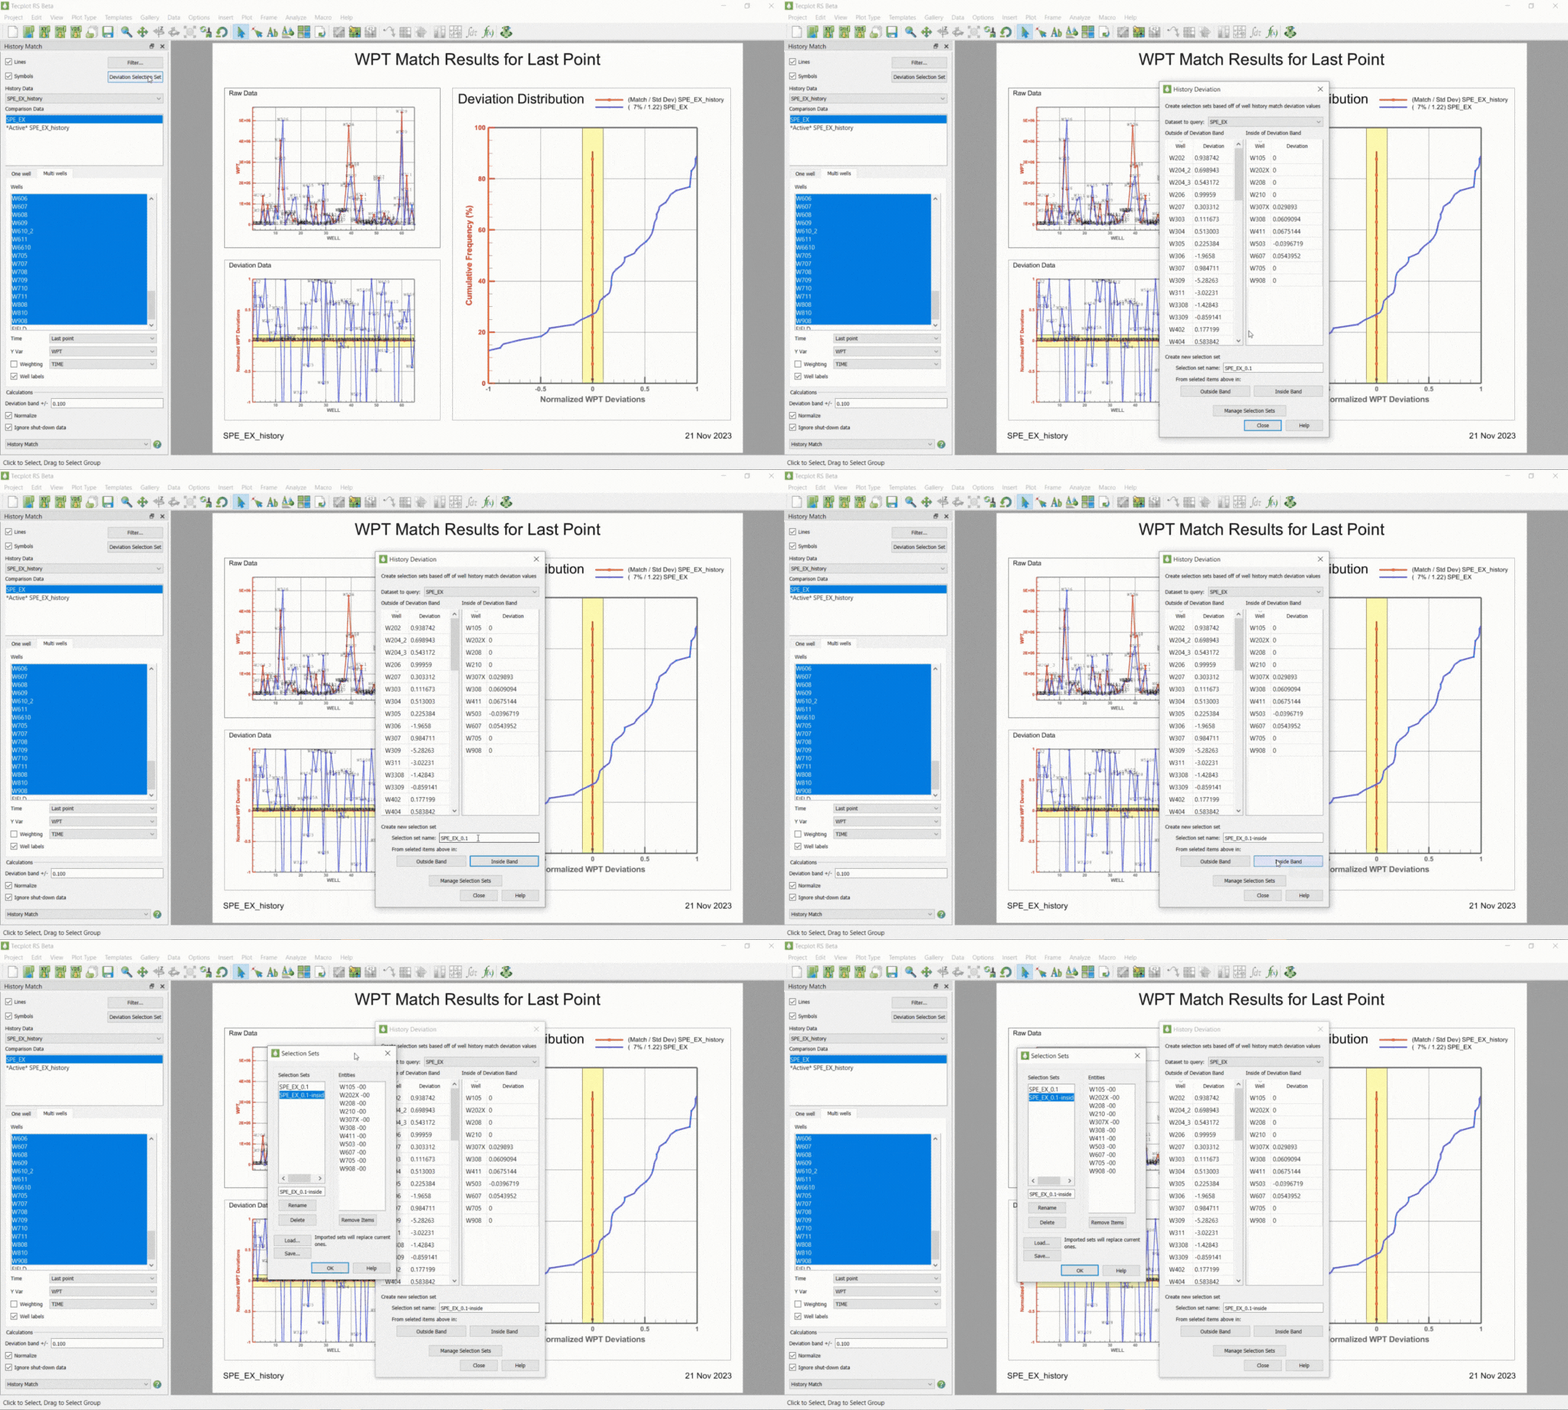
In Tecplot RS 2023 R1, you’ll now see a Deviation Selection Set button. Select that, and you’ll be presented with a dialog where you can create selection sets based on the results of the set deviation distribution band. Let’s say, for example, you want to create a selection set for the entities that fall outside of the deviation band (the poorly matched wells), you can simply press the Outside Band button. You will see a message popup to tell you that the selection set has been created properly. You can repeat that step to create a selection set for the entities that are inside the deviation band. After you are done with this process, you can select the Manage Selection Sets button to review the created selection sets.

Selection Sets Overview
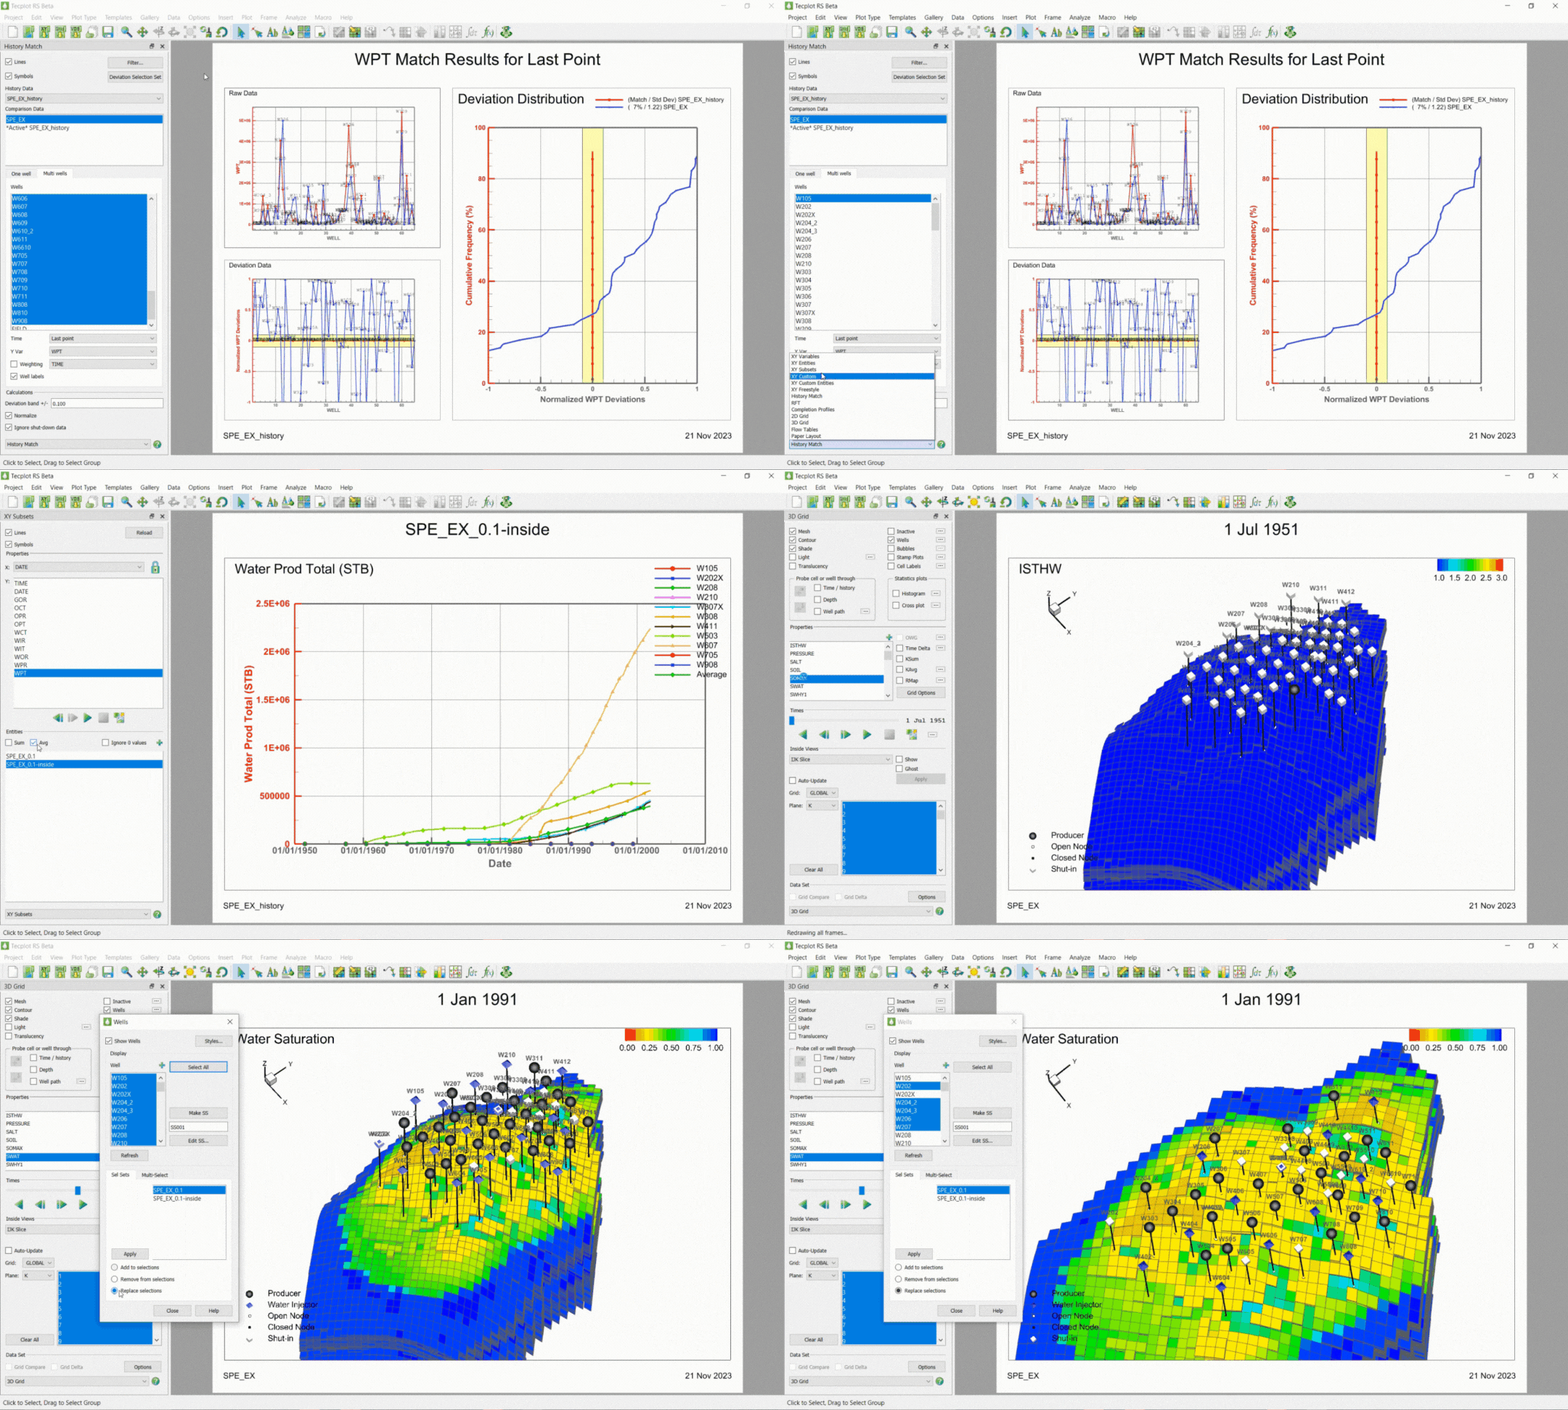
There are so many powerful capabilities of selection sets now. The first thing you may want to do is create a group. To do that, go to Data-Groups/Patterns/Branches and press OK. The groups are now created. You’ll see that in any plot type, these 2 groups are now their own consolidated entity. If you go the XY Subsets plot type, you can view all the components of the user groups together, and then sum or average them if you want. Selection sets are also powerful in 3D modes. You can use the selection set to control the well display list. To do this, go the Wells option dialog, highlight the desired selection set, choose Replace Selections, and Click Apply and Refresh. You’ll see the well display on the 3D plot update.

Ready to try out this workflow with your own data? Download the latest version of Tecplot RS now. Contact us if you have any questions or need assistance, our team is here to help!
To see this full workflow in-depth, watch our latest webinar: 30-Minute History Match Validation.


