


 MENU
MENU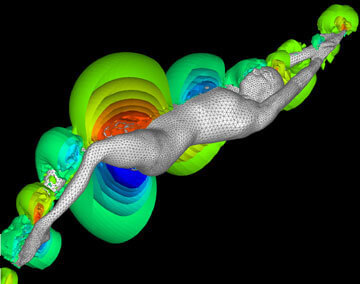
Pressure iso-surfaces around the swimmer’s body. Red indicates higher pressure, blue indicates lower pressure. Also visible is the triangular unstructured surface mesh used to represent the body.
Analyzing the Physics of Complex Flows Using Numerical Simulations
Rajat Mittal, PhD, heads up the team of 10 researchers that make up the Flow Simulations and Analysis Group (FSAG) at The George Washington University. The group’s primary focus is analyzing the physics of complex flows using numerical simulations. Alfred von Loebbecke, a graduate student and key researcher in this project, says the group’s research is motivated by the quest to answer fundamental questions as well as specific flow-related issues encountered in practical applications. The simulation of complex flows often requires specialized computational tools and the development of such tools is another area of focus for the group.
Synthetic Jets, Swimming Fish, Dragonfly Wings
Dr. Mittal first began using Tecplot 360 in 1991. In combination with the FSAG’s proprietary Navier-Stokes immersed boundary solver VICAR3D, Tecplot 360 is being used to analyze complex datasets for research projects that range from analyzing synthetic jets to fish swimming and dragonfly wings. The group collaborates with many outside partners, including NASA, Army Research Office, Office of Naval Research, Air force Office of Scientific Research and National Institutes of Health.
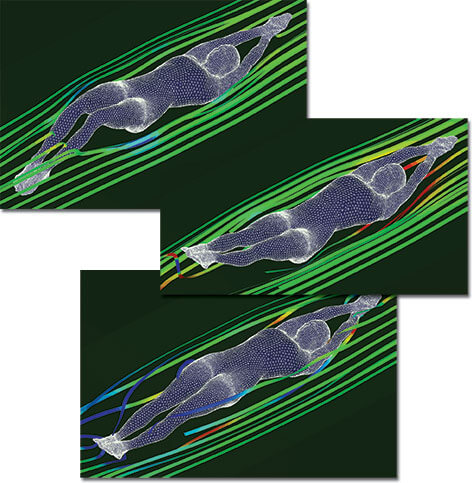
Three instances of the cycle, with streamribbons indicating flow direction. Streamribbons are colored by pressure levels; red indicates areas of high pressure, blue indicates areas of low pressure.
Navy CFD Code Used By USA Swimming
In 2003 Mittal approached USA Swimming to find out if it would be interested in collaborating on a research project on competitive swimming which leveraged some of his work for the Navy on fish swimming for which FSAG had developed a general-purpose CFD code. The organization was indeed interested in pursuing the research and provided Mittal and his team with 3D body scans of two elite swimmers, Lenny Krayzelburg and Gabrielle Rose, for use as input for simulations.
For one phase of the three-year project, the team analyzed the fluid dynamics of the dolphin kick, a strategically crucial underwater segment permitted at the start as well as turn of each lap. Underwater swimming—when it is undulating and rhythmic in a way that most closely mimics a dolphin—is now understood to be more efficient than surface stroking.
Alfred uses Alias Maya® software to create an animation that basically matches the 3D body scans frame-by-frame to video of the dolphin kicks of two Olympic swimmers, Natalie Coughlin and Michael Phelps. Both swimmers are considered excellent dolphin kickers, which gave them a tremendous advantage over competitors.
“The goal of this project is to understand what makes swimmers like Phelps and Coughlin such great dolphin kickers, both of them get a significant advantage during the dolphin kick phase,” says Mittal. “They usually come out of the water about half a body length or more ahead of the competition. We’re trying to understand the fluid dynamics behind this.”
“…visualization is key to understanding fluid dynamics. That is why Tecplot 360 is very crucial to us”
Rajat Mittal, Flow Simulations and Analysis Group, The George Washington University
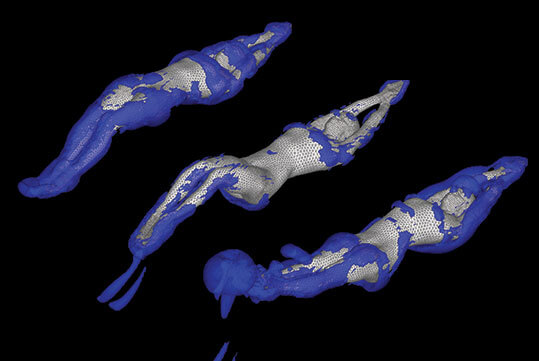
Iso-surfaces of the magnitude of the imaginary part of the eigenvalues of the deformation tensor. This gives a measure of the vorticity around the body. A ring of vorticity can be clearly seen in the third image as it is shed off the feet of the swimmer.
Examining Flow Around the Swimmers Body
To create the animation, von Loebbecke breaks one dolphin kick into 32 frames, which are then used as input for the VICAR3D code. The CFD software interpolates between those 32 frames and creates 2,000 or more frames, which were then used to create the flow simulation.
An unstructured mesh was generated for the processed body-scan data, and was then analyzed to produce both static and dynamic simulations. The animation was processed by FSAG’s three 16-CPU Beowulf clusters, each comprised of 2.8 GHz Pentium IV CPUs with approximately 16 GB of memory.
Using Tecplot 360, researchers were able to study the resulting simulations to more closely examine the 3D vortex topology of the flow around the swimmer’s body. The animated iso-surface plots, which were created using contour and iso-surface manipulation, enable the researchers to better understand the complex fluid dynamics involved.
Researchers also want to understand how much thrust was being generated by the swimmer and from where it was being generated.
“To do that,” says Mittal, “we look at the plots created in Tecplot 360 that show the surface contours of pressure on the 3D surface of the body to determine where the high- and low-pressure zones are that create the thrust. Is it the legs? Is it the toes? Or is it the thighs?”
One result of the project might be computer-calculated instructions for the mechanically perfect stroke, the one that science has determined will produce the lowest turbulence, the optimal arrangement of invisible eddies, and the swiftest route through the water.
“Tecplot 360 has provided an incredible boost to our productivity in term of our research output and the insights we are able to obtain.”
Rajat Mittal, Flow Simulations and Analysis Group, The George Washington University
Plotting and Fluid Dynamics
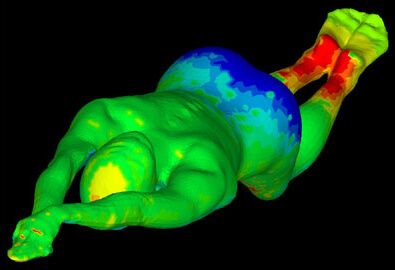
Surface pressure on the swimmer’s body at one instant during the dolphin-kick cycle. Higher pressure is colored red, and lower pressure is colored blue.
“Fluid dynamics is one of the most visual of all engineering fields, not just because it looks good but because visualization is key to understanding fluid dynamics. That is why Tecplot 360 is very crucial to us,” says Mittal. “It’s really the only way we can take apart many of these complex flows and study them. 3D flow fields are an order-of-magnitude more difficult to understand than 2D flows and so anything you can do to dissect these flows is tremendously helpful.”
Aside from its excellent visualization capabilities, Mittal says that Tecplot 360 also provides an effective means of debugging code. When trying to find a bug, the researchers will often use Tecplot visualizations to quickly pinpoint problems. “We use Tecplot 360 as much in the debugging phase as we do in the post-processing phase,” says Mittal.
According to Mittal, the software’s greatest strength is that it enables him to do everything from simply X-Y plots to complex 3D surface contours-all in one package. He also credits Tecplot 360 for its ability to run well on all platforms, from Windows to Linux and Mac, as well as its user-friendly menu system.
Mittal fondly remembers the day he was introduced to Tecplot 360 and believes it has significantly increased the ability of his team to understand the complexities of fluid behavior. “Tecplot 360 has provided an incredible boost to our productivity in term of our research output and the insights we are able to obtain.”
Other people who are contributing to this project are Professor James Hahn (CSE Dept, GWU), Russell Mark (USA Swimming), Dr. Haibo Dong (FSAG), Meliha Bozkurttas (FSAG) and Hersh Singh (TJ High School).