


 MENU
MENU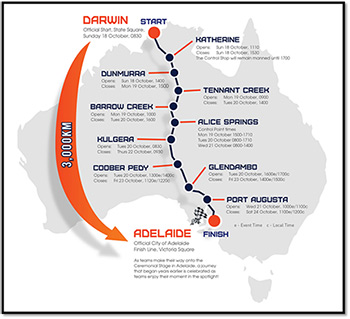
Bridgestone World Solar Challenge.
Chasing the sun 3000km across the Australian Outback is a grueling test. And doing it in a solar-powered vehicle is an even bigger challenge. But every two years teams from around the world converge on Darwin, Australia, to make the journey to Adelaide in the solar-powered cars they have engineered specifically for the Bridgestone World Solar Challenge.
The Stanford Solar Car Project, a student-run, nonprofit organization within Stanford University, has been designing and building solar cars since 1989, and arrives in Darwin every two years with a stunning new vehicle. The latest vehicle in their lineup, Arctan, took sixth place out of 45 teams in the 2015 competition, covering the 3000km in just over 41 hours.
With the aerodynamics of the vehicle playing a critical role in its performance, the Stanford Solar Car Project team developed a repeatable design-simulation framework consisting of Pointwise for rapid hybrid mesh generation, SU2 to run the CFD simulations, and Tecplot 360 to post-process and interpret the results.
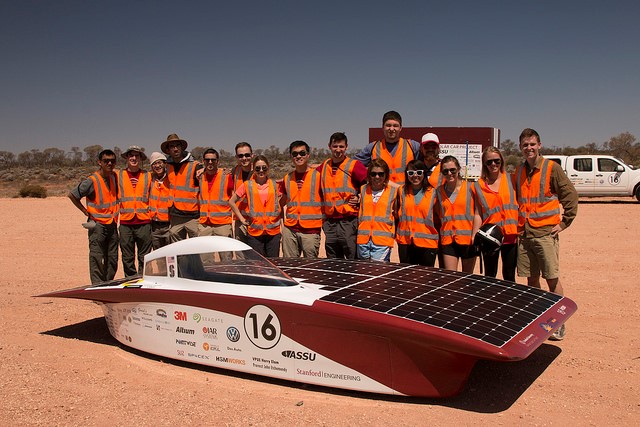
The Stanford Solar Car Project Team With Arctan.
Acting as the Solar Car team’s aerodynamics co-lead was Rachel Abril, a master’s student in mechanical engineering. She joined the team back in 2013, and for the most recent 2015 cycle she specialized in mesh generation and mechanical design analysis, and was also a driver.
According to Abril, three big factors are key to winning the race — reliability, aerodynamics and solar array. “Of course reliability is number one. If your car breaks down and you can’t finish the race, you’re out,” she explained. “As for aerodynamics and solar array, they basically define the speed of the vehicle, and sometimes they have competing interests when designing the car. We do systems analysis to try to find a good compromise.”
The development of Arctan marked the first time the team brought the entire aerodynamics tool-chain in-house, in large part because of their partnership with SU2. Developed in Stanford’s Aeronautics and Astronautics Department, SU2 is an open source collection of C++ software used for multi-physics simulation. The main reason the Solar Car team used SU2 was for computational fluid dynamics (CFD).
The team’s other key partners were Fort Worth, Texas-based Pointwise for CFD mesh generation and Tecplot of Bellevue, Washington, for data visualization and analysis.
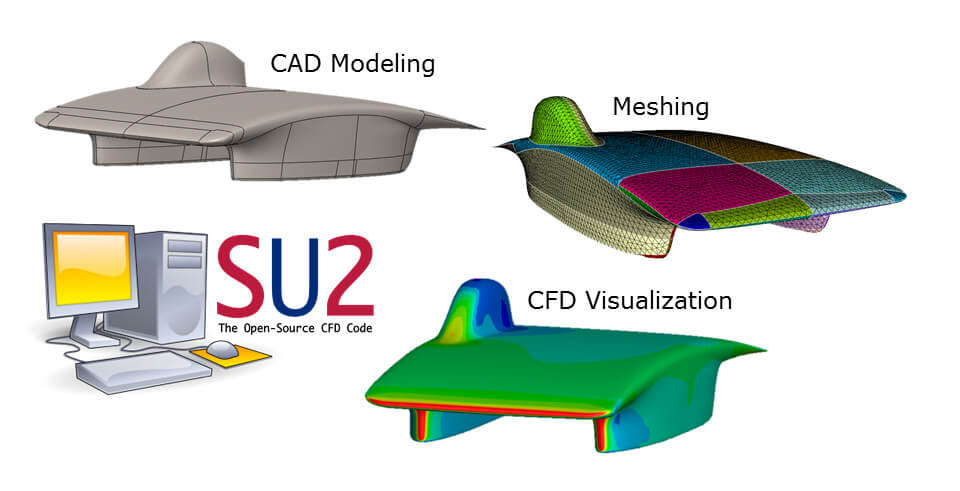
The aerodynamics tool-chain with SU2 CFD Code, Pointwise Meshing and Tecplot Visualization & Analysis.
“Some challenges that we always face are the packaging of mechanical components like the suspension and driver, along with race regulations that tend to limit aerodynamics,” Abril said. “We always have to figure out ways to work around these things. The basic numbers that we’re always aiming for are low drag and zero lift.”
Once the car was built and rolling, the team took it to a wind tunnel to verify the CFD results with guidance from SU2 developers David Manosalvas and Dr. Thomas Economon. The car then went from simulation and validation to on-road testing. “We put about 4,000 test miles on the car to shake out any bugs – first at a racetrack and then on public roads. The on-road test miles also serve to train our race crew and to get the drivers really familiar with the car,” Abril said.
Over 40 Pointwise Meshes Helped Create Arctan
Mesh Refinement with Pointwise
“The first thing Rachel saw when she imported her data into our mesh-generation software was a model of the car consisting of a number of different surfaces,” explained Travis Carrigan, a senior engineer at Pointwise. “The next step is what’s called Solid Modeling. Their geometry was very clean, so it was easily assembled into a single water-tight model representing the vehicle, and consisting of 46 quilts.”
A quilt is a logical meshing region where a surface mesh will be generated and boundary conditions applied. It was in the team’s best interest to simplify the topological complexity of the model by assembling quilts into larger collections that represented engineering surfaces, such as the left and right side of the canopy, the front of the vehicle, the top of the vehicle, and the fairings.
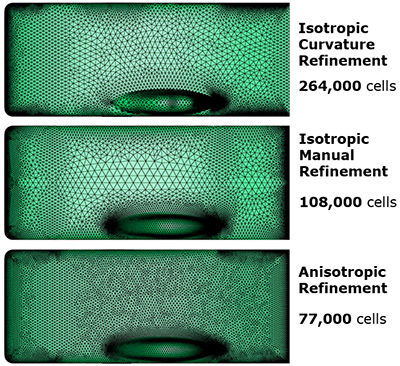
With the solid model and quilts defined, the team automatically generated a uniform surface mesh on the car, and then selectively refined areas of interest. Performing isotropic manual refinement is a very efficient way of generating a surface mesh and allowed the team to reduce the surface cell-count by more than 50 percent.
“However, there’s an additional technique that could be used to drive-down that cell count even further, and that’s called anisotropic refinement,” Carrigan said. “With this technique, we’re stretching cells and we’re marching right-angle triangles away from boundaries. This results in a grid that appears even finer with fewer cells.”
The last step is volume meshing. The team elected to use T-Rex, which stands for anisotropic tetrahedral extrusion, to automatically generate a hybrid viscous volume mesh for the vehicle. T-Rex advances elements off of the surface to create thick stacks of prism elements that transition naturally to isotropic tetrahedra in the farfield.
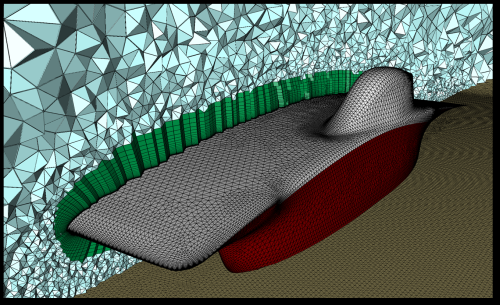
Pointwise T-Rex Volume Meshing
“The first thing you want to look at is the surface mesh quality. Why? You’re going to be growing elements off of the surface mesh, so if you can guarantee that you have a high-quality surface, that’ll go a long way toward helping you generate a very high-quality volume mesh,” Carrigan explained.
Stanford’s Open Source SU2 Code Used for CFD Simulation
The Solar Car team used the SU2 suite to simulate the aerodynamic behavior of the car. Taking into consideration the speed at which the car was expected to cruise and the atmospheric condition of Darwin, the simulation was set-up to use the incompressible solver built into SU2.
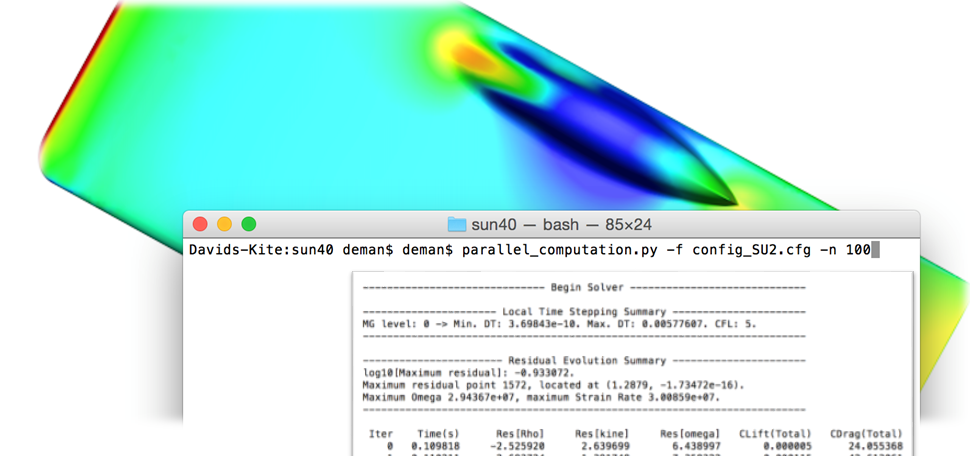
Running Stanford’s SU2 Code
“When we were looking at our simulation and its convergence, we were interested in looking at the forces on the car itself,” said Manosalvas, the SU2 developer and a Ph.D. candidate at Stanford University. “That’s where marker plotting and monitoring, both SU2 options, came into play. We selected all the surfaces of the car to track the convergence of the integrated forces on those particular surfaces and then wrote them into a history file.”
After that, Manosalvas explained, the team needed to choose a numerical method. They chose the second-order Roe scheme in conjunction with the first-order Spallart-Allmaras turbulence model, which are considered industry standards. Finally, the mesh name and type were specified in the configuration file. SU2 supports CGNS and SU2 formats, both of which can be exported directly from Pointwise.
For the output, they chose Tecplot binary. “The main reason for going binary over ASCII, which we also support, is because it’s faster to write, it’s faster to read, and it uses less space in your hard drive,” Manosalvas explained.
Tecplot 360 Chosen as CFD Post-Processor
To understand SU2 simulation results, the Solar Car team used Tecplot 360. The first thing they needed to do is understand if their CFD simulations ran correctly. They wanted to minimize drag and get lift very close to zero. They looked for areas of drag on the vehicle, which is commonly visualized by looking at pressure contours as well as streamlines.
How did the Solar Car team use Tecplot 360 in their design iterations? They set-up a process where they would do each design iteration, and they had a set of predefined images they could create using plot layouts. A layout is a set of instructions to tell Tecplot 360 what data to load and then how to represent it in the view. For example, the team created images that show surface quantities of the pressure coefficient and streamlines going around the vehicle.
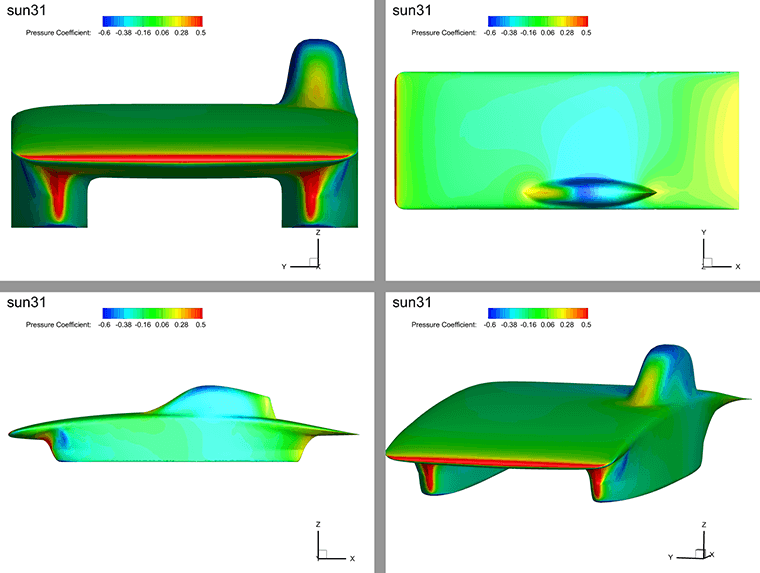
Analyze the results in Tecplot 360 using multiple frames.
Tecplot Product Manager Scott Fowler said Tecplot helped the Solar Car team create some new visualizations, including one using stream ribbons. Ribbons are interesting because they help users visualize turbulence. They can actually see twists in their flow using a ribbon.
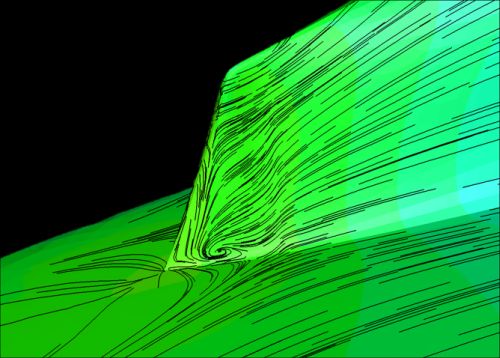
Surface streamtraces identify area of recirculation.
Using short surface streamlines, which simulate an oil-flow plot, Tecplot helped the Solar Car team identify an area of recirculation at the backend of the car’s canopy. This was a discovery new to the Solar Car team because they weren’t aware of this technique. It indicated an area of the vehicle where the geometry should be changed to reduce possible separation.
Moving on to automation and analysis, “Tecplot 360 has a fairly robust macro language, which allows you to automate many commonly used plots,” Fowler said. “The Solar Car team used these macros at the tail-end of their CFD simulations.
They had a suite of images ready for each design iteration, giving them a jumpstart on their analysis.”
Stanford’s Fastest Car to Date
Based on the performance data collected during this year’s race, the Arctan car was Stanford’s fastest car to date, but there is still a lot of room for improvement, according to aerodynamics co-leader Abril. “On the whole, our team is looking to take every aspect of the vehicle to the next level. Better meshing techniques on the aerodynamics side mean we’re going to be more efficient computationally,” she said. “Aerodynamics affects everything else on a systems level, from solar-array performance to mechanical packaging to vehicle handling. For the next cycle, we want to do that analysis from the very beginning in tandem with our aerodynamic iterations.”
Learn More
- Stanford Solar Car Project
- Pointwise
- Stanford SU2 Code
- Tecplot 360
- Bridgestone World Solar Challenge