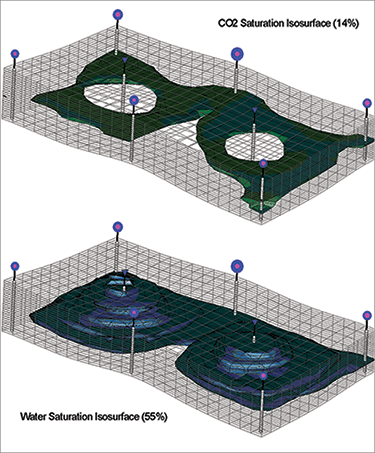
Figure 1: A subset of the total field area showing two injection wells.
The Challenge: Understanding Complex Subsurface Fluid Interactions
Before optimization of recovery methods for sub-surface oil and gas reservoirs can be obtained, a thorough understanding of the reservoir is required.
These reservoirs have many complex structural, geological, and fluid characteristics that are impossible to fully understand using actual measurements and physical testing.
Static and dynamic computer-based models and an arsenal of high-tech, computational tools are required to simulate reservoir performance and optimize the oil and gas recovery.
One company that aids in understanding subsurface reservoirs is iReservoir.com. The Littleton, CO-based company uses advanced geoscience and engineering technologies to provide its clients—oil and gas companies—with reservoir characterization, reservoir engineering, and reservoir simulation services.
The Solution: Simplify With Advanced Simulation and Visualization
iReservoir couples advanced simulation technology with Tecplot RS visualization software to comprehend the complex subsurface oil and gas formations in order to obtain insights into methods of optimizing the economic recovery of oil and gas from reservoirs.

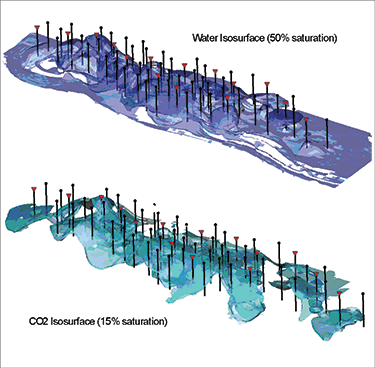
Figure 2: The plots above show a total field view of CO2 and water isocountours after long term (>10 yrs) water-alternating-gas injection.
James Gilman, Director of Engineering at iReservoir.com, says that the company uses Tecplot RS software to fully comprehend the complex solutions generated by ECLIPSE reservoir simulation software from Schlumberger. Using Tecplot RS, iReservoir.com engineers produce 3D views of static and dynamic properties of oil and gas reservoirs, along with 2D views of well production and injection rates and numerous other quantities.“We use Tecplot RS to view how water, oil and gas (as well as other injectants) flow through a simulated model of subsurface hydrocarbon reservoirs,” says Gilman. “By comparing the simulated behavior to actual measurements and then running and viewing multiple simulator forecasts, we can evaluate the economic value of various methods to optimize the recovery of hydrocarbon resources.”
Computer models of subsurface petroleum reservoirs are extremely complex, involving the solution of millions of equations over thousands of time sequences. Effective 2D and 3D visualization of these simulations results provides an improved understanding of the flow characteristics, in order to design optimal well patterns and recovery schemes for maximizing the economic recovery of hydrocarbon resources.
“We use Tecplot RS to visualize calculated fluid-flow through computer models of complex subsurface oil and gas formulations and to view the resulting fluid rates at wellbores,” says Gilman. “When properly calibrated, the models provide insights into methods of optimizing the economic recovery of oil and gas from such reservoirs. Visualization aids in the optimization process.”
Figure 1 illustrates the CO2 and water fluid fronts during water-alternating-gas (WAG) injection into an oil reservoir. This subset view of the total reservoir has two injection wells, each surrounded by four producing wells. Water is used to control early breakthrough of CO2 at injectors and thus maximize the retention of CO2 in the reservoir. The bubbles on the wells represent the water rate (blue) and the gas-oil ratio (purple).

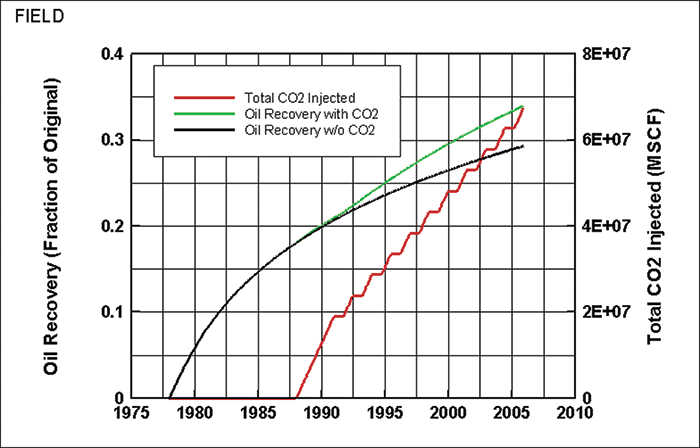
Figure 3: The above plot shows total field oil recovery as a fraction of the original oil-in-place with and without CO2 injection. This shows additional oil recovery with the use of CO2 and may provide economic benefit depending on the incremental cost of CO2 injection. Water injection is required for both cases. For the CO2 case, the period of water injection (which alternates with gas) is indicated by the stair-step nature of the total gas injection curve (red).
The plot was generated using data from a simulation of CO2 and water injection using ECLIPSE. The 3D views were created using the iso-surface features in Tecplot RS. The rate-time information from the producing wells was used to generate the bubbles using the bubble plot feature in Tecplot RS. The plot showed iReservoir.com engineers how water-alternating-gas (WAG) improves the sweep efficiency and retention of the CO2 injectant in the reservoir.
Early breakthrough of CO2 results in inefficient (i.e. expensive) operation of a CO2 flood. The simulations can be used to optimize the timing and volumes of the water and gas during WAG injection or to study other means of profile control to improve the sweep efficiency and retention. Figure 2 shows the complete reservoir after long term WAG. Figure 3 shows the enhanced oil recovery resulting from using WAG injection.
Gilman, who has used Tecplot RS software for three years, believes the software’s greatest strengths are its ability to visualize large, complex 3D datasets involving millions of grid cells; its ability to produce many different types of professional-quality plots (eg. XY, 2D, 3D, scatter & bubble); and its ease of loading multiple sets of reservoir simulation and reservoir engineering data.
“Tecplot RS differs from other visualization packages on the market in several ways,” says Gilman. “Tecplot RS is easy to use, offers more capabilities, and produces better-quality images, both on screen and hardcopy.”


