Contributed by Dr. Baki Farouk
Drexel University
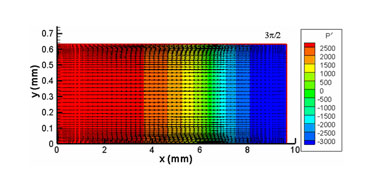
Figure 1. The interactions between acoustic waves and viscous flow, heat and mass transfer fall into a general class of problems known as acoustically-driven convection.
Although acoustic waves are usually produced mechanically by the use of a vibrating diaphragm (common audio speaker), they can also be created thermally, using the rapid heating or cooling of a compressible fluid. For a confined or partially confined compressible fluid, a sharp change in boundary temperature can cause pressure waves to propagate through the medium in the same way as does pushing a piston through a gas-filled pipe or by the vibrating surface of an acoustic driver.
Interaction of acoustic waves and a solid surface can create interesting steady, second-order bulk motion of the fluid, known as acoustic streaming. Acoustic streaming may be effective in accelerating certain kinds of rate processes and has applications in localized micro-mixing, convective cooling, and electrochemical process enhancement.
Problem Statement: Numerical simulations of the standing wave and acoustic streaming in a resonator filled with nitrogen (Fig. 1) are presented.
The initial gas pressure in the resonator is 1 atm (101 KPa), and temperature is 300 K. The vibrational frequency of the left wall is chosen as f = 20 kHz. The corresponding wavelength of the sound wave at this frequency is λ = c/f = 19.26 mm, where c is the acoustic speed. The harmonic displacement and the velocity of the vibrating wall are given as X = XMAXsinωt and μ = ωXMAXcosωt where XMAX (= 10 μm) is the maximum displacement of the wall, and ω is the angular frequency of the vibration (ω = 2πf). For the present calculations, L = λ/2 = 9.63 mm, H = 40δγ=0.632 mm. Here δγ represents the acoustic boundary layer thickness, given by δγ =(2γ/ω)1/2 and γ is the kinematic viscosity of the fluid.
The Researchers
Research being conducted at the Department of Mechanical Engineering and Mechanics at Drexel University in Philadelphia is delving into these complex phenomena and using Tecplot software to visualize its findings. Dr. Bakhtier Farouk, a professor at Drexel University, along with his research team comprised of graduate students, is carrying out experiments that investigate acoustic convection in an enclosure.
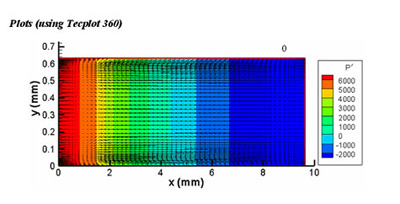
Figure 2: Instantaneous pressure contours (P’ = P – P initial Pa) and velocity vectors at t = 99 t, where t is the period of the wall oscillation
The characteristics of both mechanically-driven and thermally-generated acoustic waves in gases, liquids and supercritical carbon dioxide are being studied both experimentally and numerically. A sophisticated numerical algorithm is also being used to explicitly simulate the acoustic wave along with the fluid flow and heat transfer.
As part of the overall research project objectives, Professor Farouk and his students are studying acoustic streaming motion in a compressible, gas-filled 2D rectangular enclosure. Specifically the compressible flow, pressure, density and temperature fields in an enclosure driven by a vibrating side wall are being simulated.
Classical streaming structures are found to be present when the acoustic wavelength λ (= c/f, with c being the local acoustic speed and f being the frequency of the vibrating side wall) is a multiple of the length of the enclosure L (λ = L/2, L, 2lL .etc.). The sound field intensities on the formation process of streaming structures are investigated by direct numerical simulation. While the first order motion created by the vibrating wall is always time-dependent, the second-order acoustic streaming motion (when present) phenomena is steady.
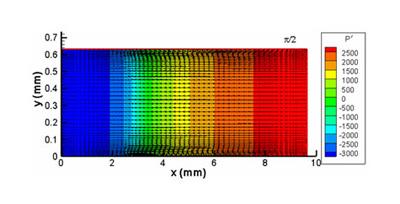
Figure 3: Instantaneous pressure contours (P’ = P – P initial Pa) and velocity vectors at t = 99 t + t /4, where t is the period of the wall oscillation
“When we are driving this device with a piston, as soon as this piston moves there is a pressure (acoustic) wave that is traveling down with acoustic velocity” says Dr. Farouk. “While the particle velocities are small, the pressure wave will travel with the local acoustic speed. When the length of the enclosure matches the wave length of the acoustic wave generated, steady streaming motions result.”
The interaction of the pressure waves with the viscous boundary layers lead to the formation of streaming structures. These were shown by time-averaging the solutions over an oscillation period of the vibrating wall. The strength of the pressure waves associated with the acoustic effect and the resulting streaming flow pattern was found to be strongly correlated to the maximum displacement of the wall.
Plotting a Strategy
In order to better understand the acoustic wave phenomena, the researchers at Drexel performed direct numerical simulations of the time-dependent compressible flow field. Dr. Farouk explains, “We have for the first time (to our knowledge) done a direct numerical simulation of the acoustically driven flow fields without invoking any turbulence models. An explicit algorithm was used which dictates the use of small time steps in order to accurately track acoustic waves. We have been able to capture the acoustically driven primary flow fields, as well as the time-averaged second-order flow fields, like acoustic streaming.”
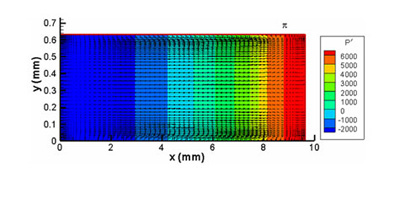
Figure 4: Instantaneous pressure contours (P’ = P – P initial Pa) and velocity vectors at t = 99 t + t /2, where t is the period of the wall oscillation
Figure 6 shows a numerical simulation of acoustic streaming in a 2D resonator. The plot shows the cycle-averaged pressure contour and velocity vectors in the resonator at the 100th acoustic cycle. Figures 2 through 5 show four instantaneous pressure contour and velocity vectors in the resonator at the 100th acoustic cycle.
The data for the plots was generated by a customized Fortran code developed at Drexel, which was then exported into Tecplot 360. Mr. Yiqiang Lin, one of Dr. Farouk’s graduate students at the University, explains what the Tecplot results revealed about their data. “The plots clearly show us the distribution of all interesting variables, such as pressure, temperature and velocity, inside the resonator at anytime, and the history of variables at some specified points,” says Lin. “Generally, we can investigate the interaction between the acoustic wave and viscous fluid and heat transfer by studying the plots that show the interesting physical phenomena at any specific time and location.”
Typically Professor Farouk’s graduate students at Drexel use Tecplot to create XY, 2D and 3D plots of their results. The plots reveal the physical relationship among the variables in the experiment so the students can see the physical phenomena. The plots are then used as a basis of discussion among the participants in the research group.
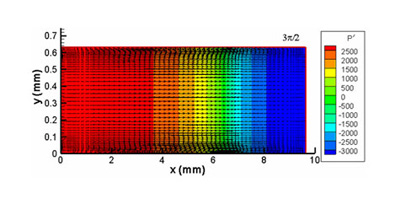
Figure 5: Instantaneous pressure contours (P’ = P – P initial Pa) and velocity vectors at t = 99 t + 3 t /4, where t is the period of the wall oscillation
Looking into the Future
According to Dr. Farouk, these acoustic streams can have beneficial or harmful affects, depending upon whether you want mixing of the fluid or not. This phenomenon has applications in enhancing mixing in chemical reactors. In some applications, the goal is to stop these acoustic waves to prevent mixing of the fluids within the structure. Current research is focused on studying acoustically driven flows in supercritical carbon dioxide filled enclosures. Supercritical fluids have liquid-like densities but are highly compressible – like gases.
![MysteryOfAcousticWaves_06] Cycle-averaged](/wp-content/uploads/2006/12/MysteryOfAcousticWaves_06.jpg)
Figure 6: Cycle-averaged pressure contour (P’ = P – P initial Pa) and velocity vectors at the 100th acoustic cycle
Keeping an eye out for practical applications for this type of research, Dr. Farouk says, “This type of flow problem also appears in a new class of machines called thermoacoustic refrigerators. In these types of refrigerators, you want to avoid these phenomena. The developed simulation tools along with Tecplot can help us design efficient thermoacoustic refrigeration systems. Current research is underway in this area also.”
Thermoacoustic refrigeration systems can achieve cryogenic levels of cooling and are being used by the military for night vision systems and for cell phone towers; anywhere very low temperatures are required. To compare with a standard refrigerator that is capable of producing temperatures as cold as -10°C, thermoacoustic refrigeration can provide temperatures as cold as -240°C.


