Contributed by Shen Heping, Software Development Manager, Hong Yuan Tech.
Cars that ride more quietly. Higher-quality acoustics in auditoriums. Aircraft that meet or noise pollution regulations. These are just a few examples of how scientists and engineers can develop more comfortable, enjoyable, or environmentally-sound products by studying the source and distribution of noise. The ability to actually see the noise distribution or what’s going on around the noise source helps researchers understand these dynamics and make decisions more quickly. This is why visualization is such an important component of the measurement and analysis tools being built by Hong Yuan Asian-Pacific Tech Co., Ltd. The Beijing-based company serves customers wrestling with noise reduction and elimination issues across a wide range of industries such as car and airplane manufacturing, shipbuilding, acoustics, and academic research. Its latest product, noiseXpertTM, is a noise measurement and analysis system that rapidly locates the distribution of noise sources both in the air and under water.
“Our system allows users to combine more algorithms and data into a single view for a more detailed level of analysis than was ever possible before,” says Shen Heping, Software Development Manager at Hong Yuan. “This gives researchers a quicker and deeper understanding of the vibration and noise characteristics of their products, which ultimately allows them to make better products. Perhaps most important, it automates expensive processes that deliver less accurate results.”
noiseXpert measures the sound pressure near a target to reveal its near field and far field of pressure, velocity, intensity, acceleration and far field directivity, as well as the target’s vibration of these characteristics. The system is made up of three components that measure and analyze noise data.
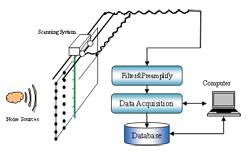
Figure 1: Schematic of the noiseXpert system. Noise data is scanned into the system, analyzed using multiple complex algorithms , and then visualized as 2D, 3D, vector, and animated plots.
Automatic scanning system. This can be compared to a camera that takes a picture of the noise. The level of detail needed for a photo will determine the number of pixels required from the camera. Similarly, researchers who want a better understanding of the sound field need more data acquisition channels and transducers, which can dramatically increase hardware costs. noiseXpert’s scanning system gives users both rough and detailed “pictures” with limited channels, saving money without sacrificing accuracy.
“Customers have tried to create similar manual systems,” says Heping. “Even so, when you compare those systems to our automatic system, they are much less accurate and the experiments are extremely time-consuming.”
Analysis. noiseXpertTM incorporates multiple algorithms for detailed sound field analysis including cover spectrum, near field holography, far field holography, beam forming, BEM, and more. Each algorithm addresses different aspects of the sound fields. The more algorithms there are to look at, the better understanding an engineer can gain of the sound field. noiseXpert also allows users to easily integrate their own algorithms, creating a highly flexible system.
“In the past, the best our customers could do was look at one or two algorithms, not all of them,” says Heping.
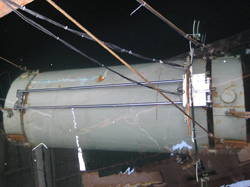
Figure 2: Experimental model of the noiseXpert system. Testing results from this model proved that the system can correctly locate sources of noise and reveal the sound field characteristics in the air or underwater.
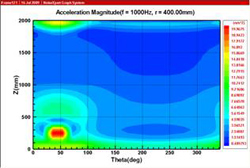
Data visualization. After collecting the measurements and calculating the various algorithms, the final step for engineers is to visualize the noise. Sound fields can be described by pressure, velocity, intensity and directivity, which can be represented in 2D, 3D, vector, and animated plots. These plots allow researchers to easily see where the noise comes from and how the sound waves flow.
“Without visualization, analysis results are just a bunch of numbers,” says Heping. “If a customer wants to create special plots, we can also customize it for them.”
Tecplot SDK
In developing the noiseXpert™ system, Hong Yuan product managers had a decision to make. They could write their own visualization code and deal with all the expert requirements, development, testing and debugging issues that come with creating a highly-specialized software program. Or they could integrate existing technology into their product and remain focused on their core area expertise.
“We’re experts in noise detection and elimination. We know how to identify, gather, and analyze noise data,” says Heping. “But we don’t know how to easily generate the plots, images, and animations that help our customers easily discover the distribution of noise and the effect of eliminating that noise. We might have tried to do it, but there was no guarantee we would get it right. Integrating existing technology just made sense.”
Heping’s developers chose Tecplot SDK for the job. As an engineering visualization framework, Tecplot SDK allows developers to quickly integrate high quality visualization and visual data services into their application. “We focus on the data analysis and leave the plotting and visualization tasks to Tecplot SDK,” says Heping. “With it, our customers can create a multitude of visuals that allow them to quickly understand the physical characteristics hidden behind the data.” Heping and his group selected Tecplot SDK because it allows them to deliver complex visualization features with simple, time-saving methods; generate a multitude of graphic elements; support a wide variety of inputs and outputs; and offer advanced features like animation. Ultimately, it allowed the company to deliver and validate two noiseXpert system prototypes in less than 10 months—much more quickly than anticipated. ”
The technical support is excellent, as well,” he adds. “But most important to us is that we’re giving our customers the ability build better products through a better understanding of noise issues.”
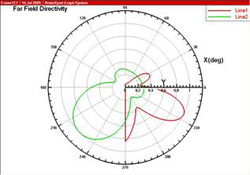
Figure 4: Far field directivity analysis result from experiment model reveals the direction in which the sound field radiates.


