In a world as technically intricate as the oil and gas industry—when billions of dollars of revenue are on the line—reservoir engineers must be confident that they have predicted the behavior of complex systems with reasonable accuracy.
Dr. Richard F. Strickland, president of The Strickland Group, is an expert in the field of reservoir behavior analysis. In his business, he is frequently asked to compare disparate reservoir simulation datasets of a single oil field, interpret that data, and determine whether the projections are reasonable or make recommendations on a plan of recovery.These datasets are almost always generated by different simulators, making it difficult to compare and validate results with reasonable accuracy.
To solve this problem, Strickland uses Tecplot RS, a reservoir simulation visualization and analysis tool for oil and gas reservoir modeling, as the common interface between them all. The program supports all major reservoir simulators including SENSOR®, ECLIPSE, INTERSECT, CHEARS, VIP, and—most recently—CMG. It also supports FrontSim and 3DSL.
Strickland recently was asked to help two oil companies determine the next steps for recovery of a mature oil field that they co-owned. The reservoir posed several challenges: it was geologically complex, thick with multiple zones, and had about a hundred wells. It also had undergone several different recovery mechanisms over the years: primary depletion, additional drilling, waterflooding, and gas injection. This level of complexity made history matching a difficult task.
The reservoir studies were completed in VIP by one of the companies and ECLIPSE by the other. After running his own simulation in SENSOR® for a third point of view, Strickland needed to compare the three sets of results. He turned to Tecplot RS reservoir visualization and analysis software to provide a unified work environment for supporting the three simulators.
“I used to license my clients’ simulators under exactly the same agreement as my own,” Strickland said. “But I gave up on that a long time ago.”

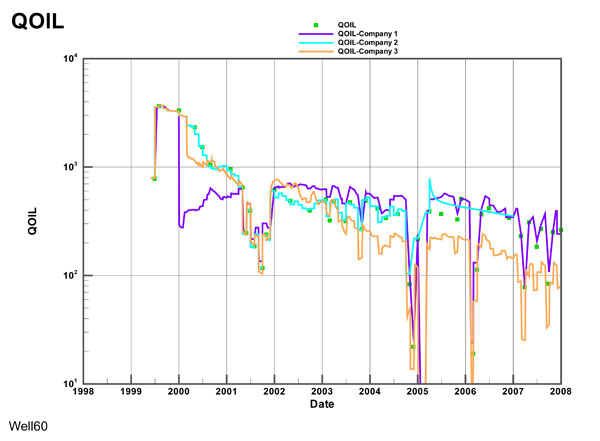
Historical and Modeled Oil production rates from multiple simulators plotted on a single graph using Tecplot RS. Image courtesy of The Strickland Group.
Strickland began by loading the XY data from the three simulators into Tecplot RS. The compare feature in Tecplot RS allows him to overlay the results from VIP, ECLIPSE, SENSOR, and the history data—all on one graph—and analyze the field parameters, well-by-well, by well group, or by the entire field.
“It lets me quickly view graphs for a wide variety of reservoir parameters including total field production, by well or group oil production, gas and water production, and pressure distributions at a well bore level,” he said. “We’re talking about a mass of data, here. Tecplot RS helps me break it down and manage it.”
The delta feature in Tecplot RS allows Strickland to see the actual difference between the history and simulated data, letting him quantify his subjective observations.
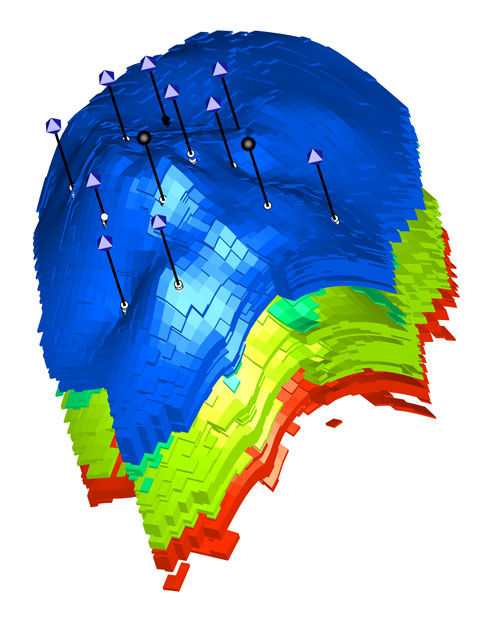
The XY data comparisons usually reveal problem areas that require a deeper understanding of the underlying causes. Strickland used the 3D visualization capabilities in Tecplot RS to spatially understand the reservoir rock and fluid distributions to determine whether the history match made sense. He was able to view animations of different properties such as pressure and fluid saturations with time, giving him a better understanding of the behavior of the field. Strickland used the slicing feature to understand important interactions, for example, how an injector and producer may be responding to each other. He also used blanking to examine regions of interest such as understanding how the gas cap is moving.

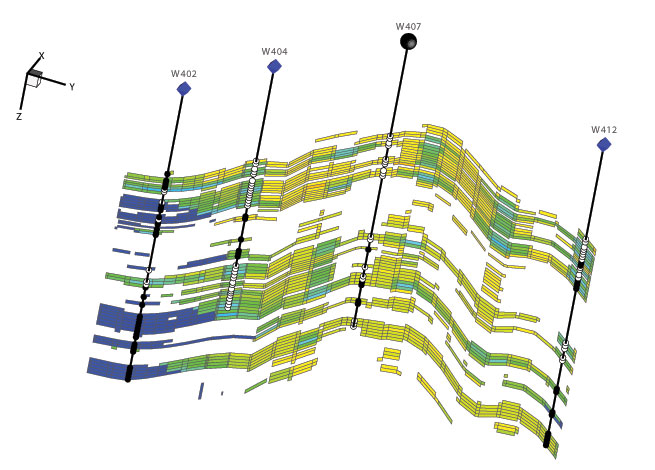
Arbitrary Slice generated in Tecplot RS. 3D images like this one can help reservoir engineers gain a better understanding of the behavior of fluid flow within the reservoir.
“I’ll peel out a chunk in the 3D grid, isolate three or four wells, turn off the other stuff, zoom down, then watch how injection wells and producers respond to each other,” he said. “How are they responding to each other? Is the oil going down, or darting to an individual well? How is the gas cap moving? Is it coning?”
Making sense from large amounts of reservoir data can be an arduous task, but by using Tecplot RS, Strickland was able to manage all his data, perform his analysis, visually explore the reservoir, and ultimately understand the different projections along with their strengths and weaknesses. In addition to a more streamlined workflow, Strickland enjoys the easy-to-use interface and publication-quality graphs he can create with Tecplot RS.
“It’s just so versatile,” he said.


