


 MENU
MENUAs computing power has increased, the volume of simulation data that reservoir engineers must work with has gone up exponentially.
Working with so much important data, it’s critical that engineers not miss anything. Vast amounts of money could be wasted if data is overlooked. And with all that data, it’s very likely some could be.
For instance, before an oil company goes to the expense of producing a field, reservoir engineers are trusted to predict the optimum drilling location. These recommendations are based on increasing amounts of data.
When we developed Tecplot RS, we spoke with many reservoir engineers and learned a great deal about how they work, how they store their data, and how they import it with their modeling software.
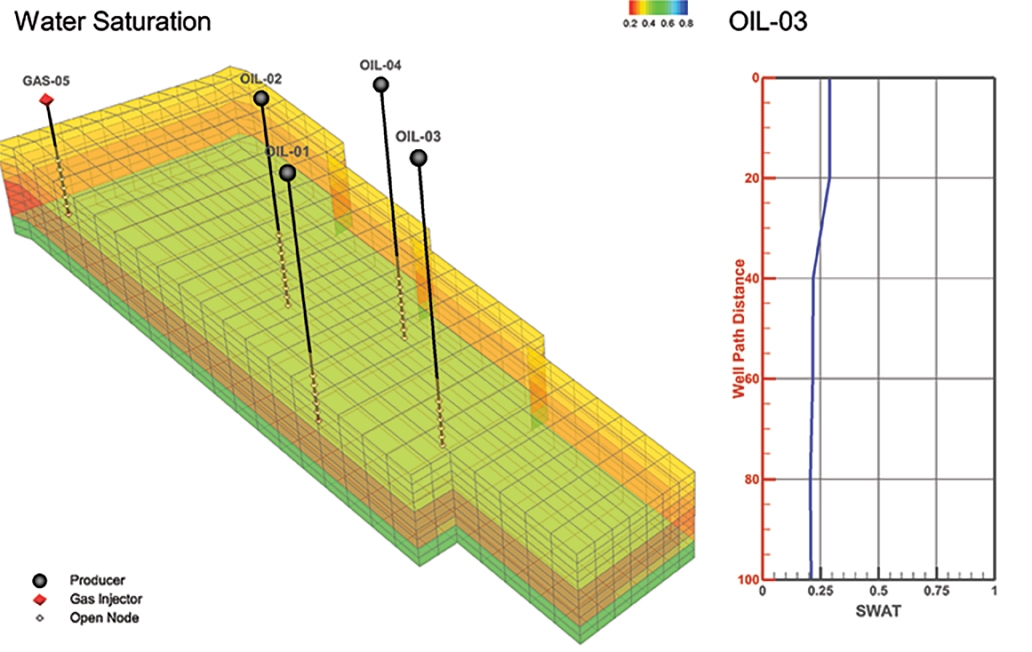
Well Path Trend Analysis in Tecplot RS. Watch the Video.
XY Meets 3D
In watching engineers work, one issue we noticed was that they have to switch from XY to 3D views and can’t see both together. Reservoir engineers have told us that being able to see both the XY and 3D view together makes a tremendous difference in the way they work and in their ability to understand the data.
With Tecplot RS, you can see your XY data and 3D data at the same time if you want. This ability gives engineers a new and faster way to understand the data they’re seeing and make unexpected connections. Now, the software you use to understand reservoir data works the they way you want it to. Tecplot RS instantly lets you have a more complete understanding of your reservoir simulation data.
In a single environment you can view:
- multiple runs simultaneously
- historical data
- geological models
The power of Tecplot RS is its ability to show you all your reservoir simulation data in a way that allows you to make more reliable predictions.
Managing Reservoirs of Reservoir Simulation Data
All the new computing power available to engineers is wonderful, but it’s led to an exponential increase in simulation data to manage and try to understand. To handle and compare all that data, to sift through it, is a difficult task. And it’s not just the recent data. Engineers looking at oil fields, for instance, are inputting data from as far back as 1950, when many of these oil fields began.
Tools like Tecplot RS make the management of this data easier with a more intuitive, simpler interface. You can open it up, start loading data and get meaningful results within about an hour. See all Tecplot RS Video Tutorials.
Try Tecplot RS for Free
Follow the Tecplot RS Tutorial Guide (PDF) »