


 MENU
MENU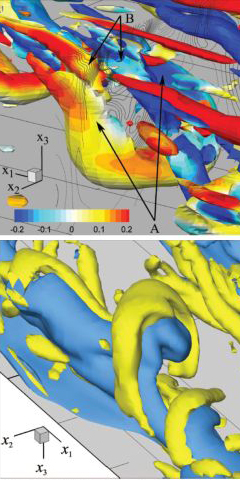
Producing beautiful snapshots of turbulent vortices is one of my hidden hobbies as an amateur artist. – Ryuichi Nagaosa, Ph.D.
Ryuichi Nagaosa, Ph.D. is a faculty research associate with the Center for Environmental Energy Engineering at the University of Maryland. A chemical engineer, he specializes in transport phenomena in the environment. His primary interest is turbulence and environmental fluid mechanics and their impact on the environment. More specifically, his research focuses on the study of turbulent heat and gas exchanges at the atmosphere-ocean interface.
Nagaosa also serves as a senior research scientist at the Research Center for Compact Chemical System, AIST (National Institute of Advanced Industrial Science and Technology) in Tsukuba, Ibaraki, Japan. He also was a visiting scientist at the Nansen Environmental and Remote Sensing Center, a nonprofit climate and environmental research foundation affiliated with the University of Bergen, Norway.
Early in his career, Nagaosa chose computational techniques as his preferred method for evaluating environmental fluid mechanics. For more than 15 years he has used Tecplot 360 software, a numerical simulation and computational fluid dynamics (CFD) visualization tool that creates state-of-the-art visual reproductions to quickly make sense of vast amounts of complex information. He uses the software as a communication tool for risk assessment of hazardous materials leakages in a closed space, and also to show the spread of the hazardous gases in our residential space.
It is Nagaosa’s belief that “inspirational-based thinking” will help us understand turbulence dynamics. In his view, this is the role of the engineer. We recently interviewed Nagaosa about his research and his use of Tecplot 360 software.
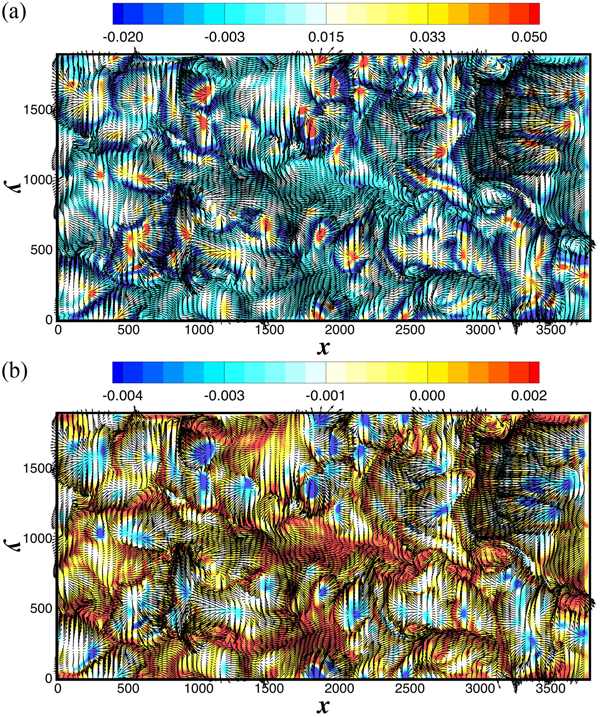
Producing beautiful snapshots of turbulent vortices is one of my hidden hobbies as an amateur artist. These snapshots were produced in very close collaboration with my Norwegian colleagues, Prof. Guttorm Alendal and Dr. Lars Inge Enstad, at the University of Bergen. When I was invited to be a guest scientist at the Nansen Environmental and Remote Sensing Center, we enjoyed several observations of the structures of turbulent vortices based on our numerical experiments. Published in Physics of Fluids, 18,055106 (2006),by Lars Inge Enstad, Ruichi Nagaosa and Guttorm Alendal.
Tecplot 360 allows me to reduce computational efforts and propose ideas for a strong, physics-based turbulence model.
– Ryuichi Nagaosa
Summary
Tecplot 360 software enables visualization of fluid dynamics, including turbulence in the atmosphere and ocean, so we can achieve better scientific understanding. The software is very helpful in visualizing vortices in water turbulence.

Observing details of turbulent flows and concentration profiles of gas transferred from the interface toward turbulent water greatly inspires me. One example of my findings using the software is to propose a detection strategy to extract “vortex” in the near-interface region of turbulent water. Published in the Journal of the American Institute of Chemical Engineers, 58, 2012, pp. 3867-3877, by Ryuchi Nagaosa and Robert A. Handler.
Producing beautiful snapshots of turbulent vortices is one of my hidden hobbies as an amateur artist. The snapshots at the beginning of this article were produced in very close collaboration with my Norwegian colleagues, Prof. Guttorm Alendal and Dr. Lars Inge Enstad, at the University of Bergen, when I was invited to be a guest scientist at the Nansen Environmental and Remote Sensing Center. We enjoyed several observations of the structures of turbulent vortices based on our numerical experiments.
Animations
Development of Fluid Velocity and Gas Concentration Mapping
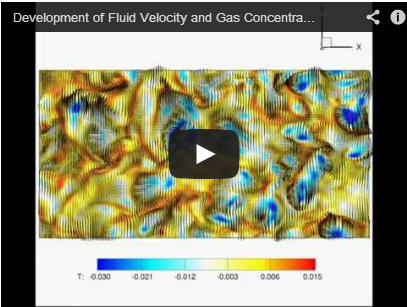
- This animation shows time development of fluid velocity and gas concentration mapping at a location very near, but not at the interface.
- The animation also illustrates a view of the turbulent flow from above the gas-liquid interface, looking downward.
- Red and blue mapping indicate the gas concentration of positive and negative deviations from the time-space average.
- We can observe an intermittent emergence of blue colors (low concentration fluid) from inside the turbulent flow, and the fluid can exchange the gas across the interface very extensively.
Turbulent Vortex Structures
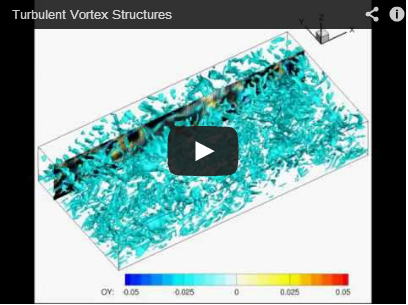
- This animation shows a perspective view of time development of turbulent vortex structures extracted by the formula used in Ref.[1].
- Many turbulent vortex structures are generated in the turbulent flow, and at some places, these structures interact with the gas-liquid interface.
- Time-development of fluid velocity mapping and vortex structures in an x-z plane is also animated in this, but the mapping is difficult to distinguish in this animation.
- Animation 3 focuses on the dynamics of turbulent vortex structures.
Turbulent Vortex Structures – side view
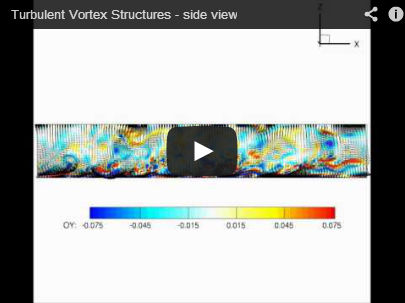
- This animation shows time development of the turbulent vortex structures by looking at the flow from its side.
- The gas-liquid interface is located at the top boundary of this animation.
- Red and blue mapping indicate the vorticity fluctuations from the time-space averages.
- Red and blue mapping of the vorticity signify the fluid flow of clockwise and anti-clockwise rotations.
Interview
Q. 1. How did you become interested in engineering?
A. 1. When I was a high school student and a university undergraduate, I loved math. And I decided to become an engineer because I believe that in our world, inspiration-based thinking will help us. Engineers provide this kind of thinking.
Q. 2. How did you come to choose turbulence as your area of study?
A. 2. I entered the department of chemical engineering and chose to join the fluid mechanics lab when I was an undergraduate. My supervisor was a specialist in turbulence research and laboratory experiments. I have been influenced strongly by his method of research for 20-plus years. I chose a computational technique as my research tool, rather than experimental fluid mechanics.
Q. 3. Why is turbulence in the atmosphere and ocean significant?
A. 3. Fluid flows in the environment are turbulent, including atmospheric and oceanic flows. Let’s consider gas transport from the atmosphere into the ocean, across the ocean surface. The concentration of the gas in the ocean varies drastically, mainly as a function of the distance from the surface. And these concentration profiles have large gradients at the interface.
In general, gaseous materials are more easily spread in air than in water. This means that the gas transport in water is much slower than that in air. Therefore, I assume that the concentration of the materials in air is uniform in space, because of its quick spread in air. Using this assumption, my attention is concentrated on computing the concentration profiles of the material only in water. This assumption is also helpful to reduce computational efforts by skipping computations of the concentrations in air.
On the other hand, I deeply understand the importance of the spread of the material in air on some occasions, for example, on a case that turbulent flows in air induce waves at the water surfaces, and consequently, turbulence in water. In this case, spread of the gas in air is not so quick at the wave crests, and we should consider this in our computations. In the near future I hope to compute the interactions of turbulent flows in air and water accompanied by the gas exchange, to understand more physically complex phenomena.
Q. 4. What Challenges Do You Face When Conducting Your Research?
A. 4. Gaseous material and heat are exchanged between the ocean and the atmosphere, and these exchange rates are determined mainly by turbulence in the ocean below the interface. Measuring small turbulent flow structures near the interface is difficult in laboratory and field experiments. My goal is to quantify turbulence in the ocean, interactions of turbulence with the interface, and the mass balance between the atmosphere and the ocean, by applying a computational technique. Many assumptions are required to perform these computations, and a significant investment of time. Tecplot 360 allows me to reduce computational efforts and propose ideas for a strong, physics-based turbulence model.
Q. 5. What are the goals of your research?
A. 5. My ultimate goal is to study turbulent flows and heat and gas exchanges across the atmosphere-ocean interface and to model exchange rates in a systematic way without having to use massive computational resources. For example, if we can evaluate the exchange rate of CO2 using only a few snapshots of the ocean surface velocity profiles or near-interface wind profiles, we can more easily understand a large part of global carbon cycles.
Tecplot 360 allows us to view flows in a beautiful and vivid manner, and this enhances our understanding of engineering and environmental science. We can also establish parameters to help predict turbulence characteristics without using complex statistical procedures. Published in the Journal of the American Institute of Chemical Engineers, 58, 2012, pp. 3867-3877, by Ryuchi Nagaosa and Robert A. Handler.
Q. 6. Why is it important for us to understand atmosphere-ocean dynamics?
A. 6. The ocean surface is one of the major entrance points for transfer of important gaseous materials such as CO2 and O2, as well as thermal energy, moisture, and so on, from the atmosphere. The interface can also be disturbed by waves generated by wind, which can alter the gas exchange mechanisms between the two flows. And, as explained earlier, turbulence in the ocean can be a major factor in determining gas exchange rates. On these points, the interaction of the atmosphere and the ocean is very important.
Q. 7. You spoke about ocean acidification due to CO2 transfer. Will you please explain this and why it is significant?
A. 7. Others have expressed concern that CO2 uptake across the atmosphere-ocean interface causes acidification of the seawater, posing potential environmental and ecological impacts (Caldeira, M. Wickett. Nature, 425 (2003), 365). Acidification is caused by a series of chemical reactions of CO2 absorbed into the ocean, and we must understand the effect of turbulence on these chemical reactions. My preliminary computations on the gas exchange across the interface show that the chemical reactions enhance gas exchange rates. In the near future I will investigate these reactions more fully.
Q. 8. How will your research expand our knowledge about global warming?
A. 8. My goal is to understand environmental fluid flows and the global carbon cycle. I do not believe that scientists and engineers can the stop deterioration of the environment. However, I know that we can notice dangers and their significance, and propose alternative technologies to save the earth. Policymakers and politicians have a greater role in saving our environment. However, we can propose solutions based on scientific knowledge. I believe that to understand the earth will help us save it.