


 MENU
MENU“Big whirls have little whirls
That feed on their velocity;
And little whirls have lesser whirls,
And so on to viscosity.” –Lewis Fry Richardson.
Anyone who has watched the flow of water down a river, or the vibration of the control surfaces on the wing of an airplane, knows that fluid flow is generally unsteady (changing over time). In fact, most data, in real life, varies with time. For computational efficiency we often assume that field data is steady (unchanging in time) but that is generally a simplification of the real physics. In computational fluid dynamics (CFD), as with elsewhere in computational physics, the trend is toward modeling of unsteady flows.
What is the best way to represent unsteady data in Tecplot files? As mentioned in my previous post on Data Sharing, Tecplot divides datasets into zones. These zones may represent different areas of the physical domain, the same physical domain at different time steps, or different results that you may wish to compare. The zones may also have different dimensionality; for example, there may be a mixture of 3D volume zones that contain field variables and 2D surface zones that contain the problem geometry and surface properties.
This means that unsteady data will have at least one zone for each time step, and may in fact have many zones per time step. Since there are frequently hundreds of time steps, the dataset may contain thousands, or tens of thousands, of zones. To make the visual analysis of this data easy and efficient, it is important to correctly specify a couple of parameters for each of the zones: Solution Time and Strand ID.
Solution Time
Solution time is a floating-point number that can either be the actual time (in seconds, for example) or some number that increases with time – like iteration number. When Solution Time is set for each zone, Tecplot’s animation capabilities are activated. Using Solution Time also improves Tecplot performance because, initially, Tecplot needs to load only the first time step.
If you are a code developer, you should take advantage of Solution Time when writing out multiple time steps. When writing binary data, this is done with the SolutionTime parameters of the TecIO TECZNE function. For ASCII data (not recommended except for very small datasets) Solution Time is set by specifying the SOLUTIONTIME in the zone header.
Strand ID
Strand ID is an integer number used to group zones together for various purposes. When dealing with time-dependent data, Strand ID is used to identify related zones through time. For example, if a sequence of zones represents the variation through time of data on the same geometric region of the wing, they should be assigned the same Strand ID. Likewise a separate Strand ID number would be specified for zones representing the fuselage, or volume zones.
In practice, Strand ID is a way to condense the amount of zones you work with while setting style for your plot. Style is set using tables in the Zone Style dialog. If you have thousands of zones it can be cumbersome to set the style for all zones. If Strand ID is set, the style is set simultaneously for all zones with a given Strand ID. In the Zone Style dialog, you only see the Strands. If you have 100 time steps, there are 100-times fewer strands than zones so they are far easier to work with.
Like Solution Time, Strand ID is a number (an integer in this case) which is set when the zone is created. When writing binary data, this is done with the StrandID parameters of the TecIO TECZNE function. For ASCII data (not recommended except for very small datasets) StrandID is set by specifying the STRANDID in the zone header.
Example
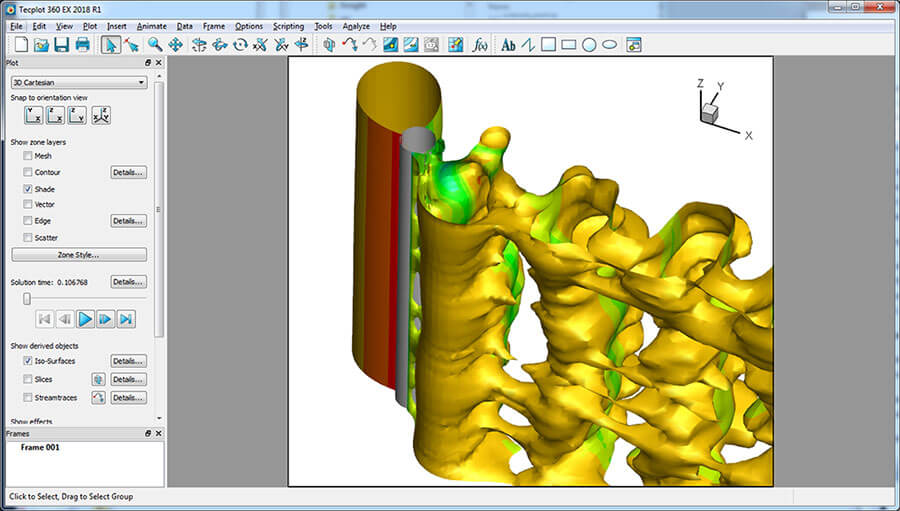
One time step of vortex shedding behind a swept cylinder.
The image above is of one time step of vortex shedding behind a swept cylinder. The dataset contains 100 time steps with 14 zones per time step. Solution Time is defined for all zones and you can see that the animation controls are active. Strand ID’s are also defined for each zone, with strand 1 being zones 1, 15, 29, …, strand 2 being zones 2, 16, 30, …, and so on. The image below shows the Zone Style dialog which contains only 14 rows, one for each of the 14 strands. The * next to the zone number indicates that it is actually a strand and the zone number at the current time, as specified by the animation controls, that is shown. If we had not defined Solution Time of Strand ID’s, Zone Style dialog would have had 1400 rows.
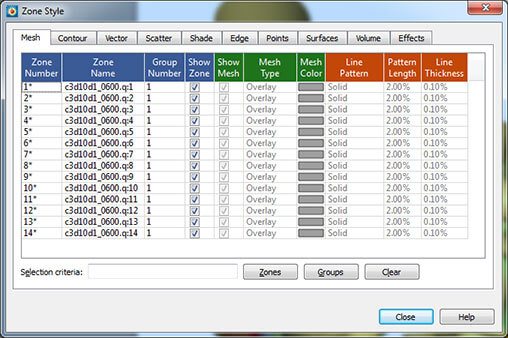
Zone Style dialog which contains only 14 rows, one for each of the 14 strands.
In Summary
- Do set the solution time for zones in time-dependent data. It enables special features in Tecplot, like animations, and it improves the performance.
- Do set the Strand ID for zones in time-dependent data. It simplifies the setting of plot style and improves the user experience.
Happy computing!

Scott Imlay
Chief Technical Officer
Tecplot, Inc.