


 MENU
MENUDescription
An iso-volume is an important concept when you need to quantify the volume occupied by scaler or a set of scalar values. In ocean sciences, an iso-volume can be used to visualize and quantify values, like dissolved oxygen, an indicator of poor water quality. In diesel engines, an iso-volume can be used to identify regions in the cylinder contributing to emissions.
In this video, we will show you how to use Tecplot 360 to create an iso-volume based on two variables and to compute its volume as a quantitative measure.
We’ll start with a dataset already loaded. This dataset is a segment of the piston bowl in a diesel engine. Understanding regions that are generating emissions are an important aspect of diesel engine design. In this case, we want to identify regions of high nitric oxide, or NOx. Areas of high temperature contribute to the creation of this gas.
In this case, we want to identify regions where NOx is greater than .005 and temperature is above 2,000 Kelvin. To isolate this region, we will use value blanking to eliminate the regions where NOx and temperature are below our target values. Both NOx and temp are cell-centered variables, so we blank the cells when the primary, or cell-centered value, is blanked.
Once you turn on value blanking, notice that your entire plot disappears. This is because we’ve only been visualizing the boundary data. The regions of high NOx and temperature exist only in the volume cells, so we must display the volume cells. We do this by displaying the exposed cell faces of the volume data. Click the Surfaces tab of the Zone Style dialog. We also want to continue to see the outer boundary of our dataset, so we change the boundary zones to ignore the value blanking constraints. Now we’ll change the shade color of the volume cells to red so that they’re easy to identify. Then, advance through time to see the propagation of our iso-volume through time.
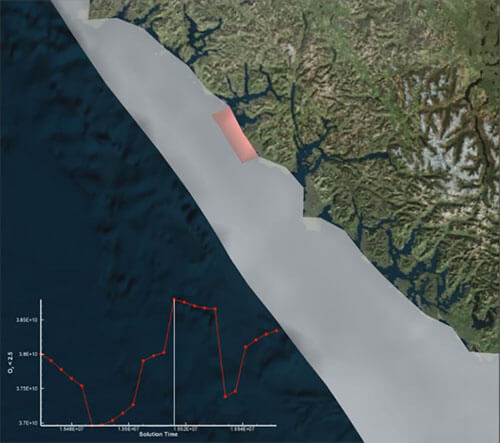
Finally, we want to quantify the volume of these regions, which would allow us to measure the effectiveness of design changes that attempt to reduce NOx emissions. We’ll use Analyze > Perform Integration, to integrate the volume of the remaining cells. For the domain of integration, choose Integrate by time strands and select the time strand for the volume cells. Ensure that you select Exclude blanked regions since we’re using value blanking to define the iso-volume.
Now we want to plot the results so we will toggle off Show tabulated results and toggle on Plot results as. Clicking Integrate will plot the results.
This data can then be saved to a file, or the results from other simulations can be imported for comparison purposes.
To repeat this process for other datasets, we could record our steps with a macro or Python script.
This concludes the tutorial for analyzing iso-volumes. Thank you for watching.