


 MENU
MENUTecplot 360 Basics Getting Started: Dataset Information
View the summary information about your dataset in the Tecplot 360 Data Set Info dialog.
Follow along in the video by downloading and extracting the files from the Getting Started Bundle. The 2.4 MB Bundle file contains data used in many of our video tutorials and contains our Tecplot 360 Getting Started Guide. This video uses the OversetCylinder.szplt dataset in the flowFlowOverCylinder folder in the Getting Started Bundle.
Download the Getting Started Bundle
 Dataset Information
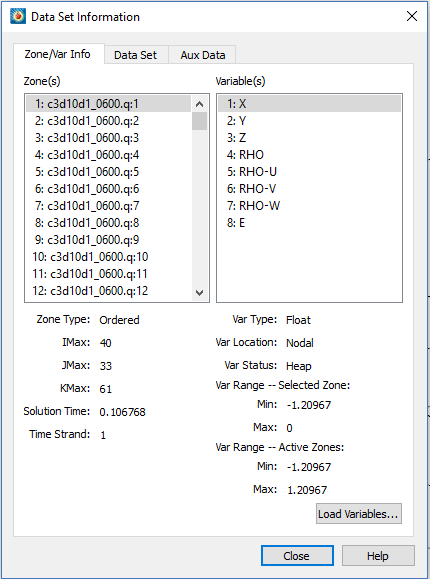
The summary information about the current dataset, including the dataset title, zone and variable names, and the minimum and maximum values of a selected variable, is in the Data Set Information dialog. Open it by choosing Data Set info… from the Data menu.
In the Zone/Variable Info page, you can see that this case has 1,100 zones. Zones are regions of connected information that represent an area of data on the plot.
Variables are listed, and for this dataset you can see the coordinate variables (X, Y, Z), the vector variables (RHO-U, RHO-V, RHO-W) and the fluid variables (RHO and E).
The Zone Type information shows that this case is an ordered dataset with IJK as the dimensions of the Cartesian mesh.
The right side of the dialog shows Variable Type, location, status and variable ranges with minimum and maximum of both the currently selected zones and all active zones. You can step through the zone variables to see the variable ranges.
The Solution Time defines the current time step of this particular zone.
The Time Strand identifies a particular region over time. For instance, this region is defined by the same strand “1” throughout time, and you can have the same style for that region as you step through time.