Sun glinting off wing
Shock waves bouncing to and fro
Shadow fairies dance–Poem and Blog by Dr. Scott Imlay, Chief Technology Officer, Tecplot, Inc.
I was five and my family was flying to Hawaii for vacation. My father and I were sitting near the wing of the Boeing 707 as we passed through mild turbulence. Dad, pointing out the window, said “do you see the fairies dancing on the wing?” I looked and, sure enough, there were almost imperceptible shadows bouncing forward and back on the wing. Dad explained that these were shock waves and that, when the sun was just right, you could see them. My older self understands that it was like a shadowgraph where variation of density through the shocks wave bent light unevenly. My five-year-old self was simply enchanted!
This is my earliest memory of unsteady fluid flow. The truth is that unsteady flow is everywhere, for example:

- Waves breaking on a beach.
- Eddies swirling behind a building.
- Flow over a bird’s flapping wing.
- And, yes, shock waves dancing on a wing.
Unsteady Flow is All Around Us
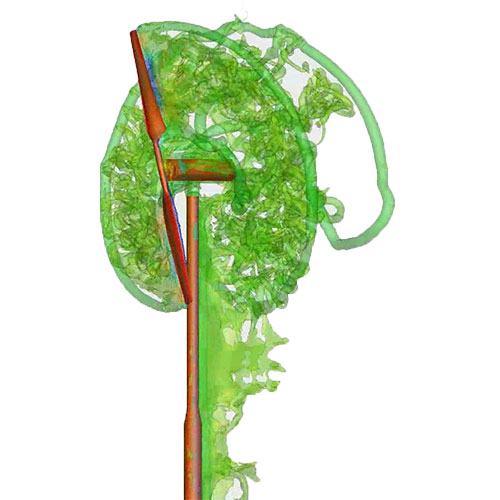
They are all around us and unsteady flow dominates many of our most important engineering flows – like internal combustion engines and pumps. Despite this, most computational fluid dynamic (CFD) calculations have been done assuming steady flow. This is because computer power is limited, and engineering flows are complicated. The actual flow over a transonic wing may have dancing shock waves but you can get a reasonable estimate of average lift and drag by solving the Reynolds-averaged Navier-Stokes (RANS) equations for steady flow. This is gradually changing as computers continue to get more powerful. Large unsteady CFD calculations are becoming more common as time goes on. NASA is predicting 10-billion cell unsteady CFD simulations by 2020 – that’s less than a year away!
Improving Visualization of Unsteady Analysis
Knowing this we are working to improve our visual analysis of unsteady flow. For example, we are working on improvements to things like animation over time and time-varying integrated quantities.
One of the biggest issues with unsteady data is the amount of data generated. Typically, you will want to analyze the data at hundreds of time steps, so the data file size will be hundreds of times larger than the steady flow solution of the same grid resolution. In addition, unsteady flows like large-eddy simulations (LES) often require finer grids than steady flows so the total amount of data to be analyzed could be three or four order-of-magnitude larger than for steady flows.
As I’ve discussed in previous blogs we already have a disk I/O bandwidth bottleneck. Unsteady flows make this bottleneck orders-of-magnitude worse.
In Situ Solutions
One solution is to do some processing of the data in the CFD code to reduce the amount of data written to long-term storage. The processing done in the CFD code is called in situ (in place) processing. In its most extreme form, all processing is performed in situ and all that is written is the resulting images or videos.
We are investigating the other extreme, where you do a minimal amount of processing in situ and use Tecplot 360 to perform the visualization. This involves writing the minimal subset of the volume data necessary to create the desired images. The details are given in a paper I gave at the AIAA Aviation Forum in Dallas, TX on June 20, 2019. You can download it here: In Situ Visualization of 10-Billion Cell Transient Data via Subzone Writing.
Since the AIAA Aviation Forum we have added a simple form of this in situ processing to our TecIO library. We are currently investigating the parallel write performance of TecIO for in situ data.
Stay tuned to this blog for updates!


