


 MENU
MENU
Without a visualization component in the design optimization loop, precisely configuring an aircraft’s tail strake position is simply impossible. Tail strakes are “fins” mounted horizontally on the rear fuselage that add stability and controllability. Engineers at the German Aerospace Center (DLR) found that the visualization component was crucial in understanding flow effects of a generic transport aircraft they were designing.
One requirement was the ability to load cargo at the aft end of the aircraft. This feature included a long, upswept ramp you can see in Figure 1. The fuselage upsweep created strong vortices as shown in Figure 2. The vorticies lead to flow detachment which reduced pressure recovery and increased drag. The DLR engineers needed to find a way to keep the flow attached and the drag reduced.
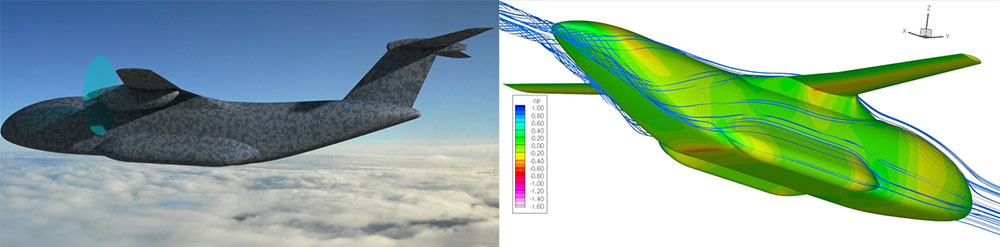
Figure 1. Long upswept ramp feature on generic transport aircraft. Figure 2. Vorticies along the ramp.
Finding an Optimal Tail Strake Position
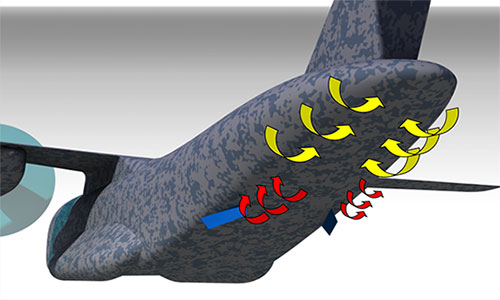
Figure 3. The problem was finding the optimal tail strake position.
The Goal
Our goal was to weaken the tail vorticies caused by the ramp. To do this, tail strakes needed to be precisely configured to produce effective counter-rotating vortices.
The Challenge
The problem was to find the optimal tail strake position and orientation (Figure 3).
The Method
A design optimization – from CAD to mesher to solver and optimizer – included a visualization tool, Tecplot 360, which helped in understanding and trusting the results.
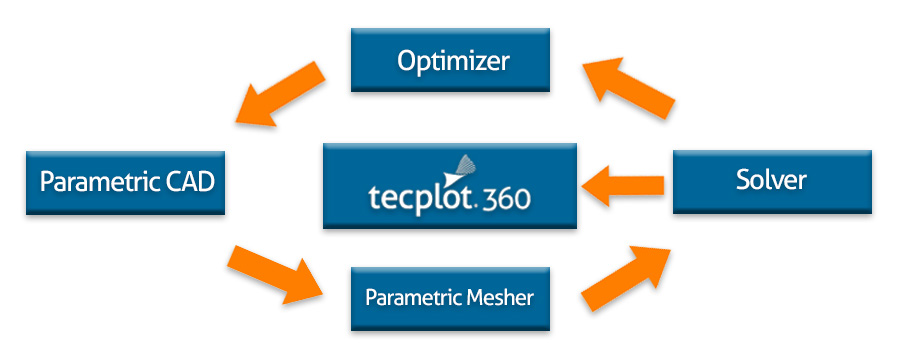
Figure 4. Design optimization loop: Parametric CAD (CATIA V5), Parametric Mesher (CENTAUR), Solver (TAU+2xAdaptions, Optimizer (SUBPLEX) and Visualization with Tecplot 360.
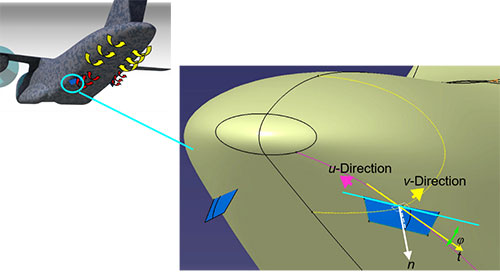
Figure 5. Three parameters were investigated.
Three parameters were investigated as shown in Figure 5:
- Strake position along u-isocurve of tail surface (generally the fore-aft position)
- Strake position along v-isocurve (radial location on the fuselage)
- Rotation angle φ against tangent in u-direction (angle of the strake against the fuselage)
The Results
The resulting XY plots, produced by Tecplot 360, are shown in Figure 6.
- The optimizer did a good job, showing ideal asymptotic convergence of objective and design variables.
- The optimization resulted in a 4% improvement of lift to drag ratio due to strake location – a very significant improvement.
- A 28% difference between worst (No. 4) and best (No. 44) strake position showed the importance of precisely locating the strake for maximum benefit. See Figure 7.
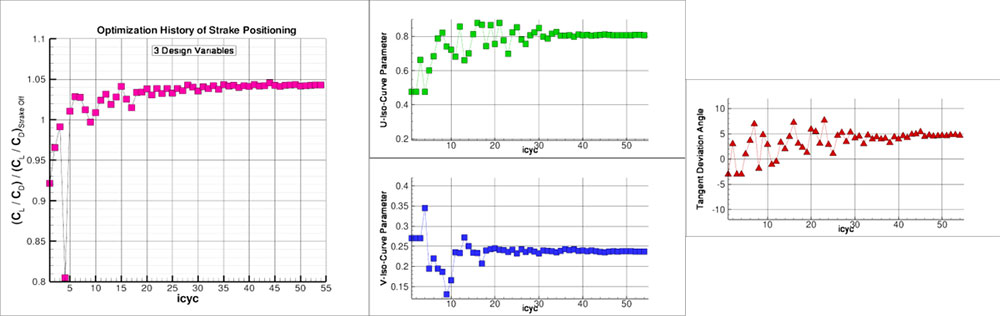
Figure 6. The results are shown in Tecplot 360 XY plots.
Best and Worst Tail Strake Position
In the worst tail configuration, the strake amplified the tail vortex, leading to a larger area of separation and high drag. In the optimal configuration, the strake truncated the tail vortex and minimized separation. While optimizers are generally good at driving to a desired result, understanding and trusting the underlying physics requires good visualization. Best and worst scenarios are shown in figure 8.
Optimization with high-quality tools found the best position. Visualization with Tecplot 360 was crucial in helping understand the effects.
Get Help Optimizing Your Workflows
Contact Tecplot Europe:
Phone: +49 (0)9402 9480–0
Email: info-eu@tecplot.com
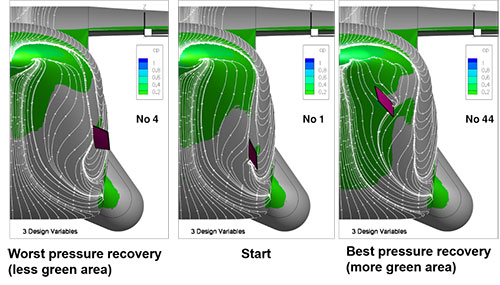
Figure 7. Comparison of tail configurations.
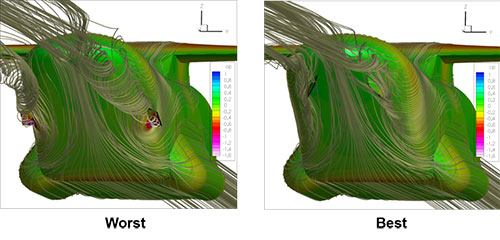
Figure 8. Best and worst tail configuration.