


 MENU
MENUNo Loader? No Problem! Using Python to Load Custom File Formats – Part 1
Learn how to load custom data file formats using the Tecplot 360 Python API, PyTecplot. In this training, we cover:
- What is PyTecplot?
- Demo loading Haiti Earthquake data
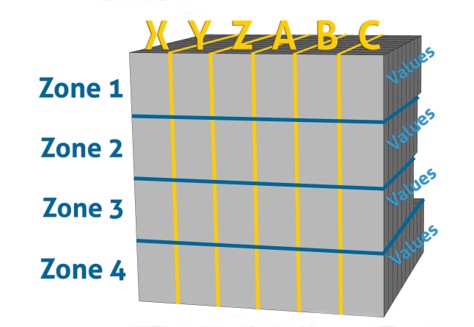
- Overview of data organization and terminologies
- Python data access APIs (in brief)
- Loading XY-line data
- Putting it all together
Q&A from Tecplot 360 Basics – Load Custom Data File Formats with Python
Can PyTecplot compute a time average?
Yes! See the Time Average script on our GitHub site, TimeAveragy.py.
Can PyTecplot automatically do data probes over time?
A: Yes again! See the script on our GitHub site, tpprobe.py.
You may also want to try Tools>Probe to create a time series plot right in the Tecplot 360 user interface.
Is there a Python script to unite multiple meshes?
Of course! See the GitHub script, CombineFEZones.py.
This script loads an example dataset, so you’ll have to modify it to load your data, or simply use data that’s already loaded.
Can we achieve high quality videos with PyTecplot? and can you show how to generate plots using PyTecplot?
Yes. PyTecplot uses the Tecplot 360 engine, so the image and video quality will be the same as if you exported directly from Tecplot 360. See the PyTecplot Export module here in our documentation
When exporting a sequence of images using a script, is there a significant difference between macros and PyTecplot?
No. PyTecplot and Macros use the same Tecplot 360 engine, so there will be no difference in image quality. There may be slight differences in performance, as each language is an interpreted language and the cost of interpreting is different.
PyTecplot in ‘batch’ mode runs faster than PyTecplot in ‘connected’ mode.
How can I find the cell that has the maximum and the minimum values?
To do this, use this script in our Tecplot GitHub repository. It finds and places a scatter point at the min or max values. This Knowledge Base article shows you how.
Where do I go for Tecplot Technical Support
To find support in your region, please visit see our Distributor Map, and scroll down for contact information.