


 MENU
MENUUsing Tecplot 360 with Excel
Tecplot Resources
This video will take you step-by-step through using the Tecplot 360 Excel Add-in.
Get the Excel data used in the video, and download the slide deck.
- Introduction to Tecplot
- Tecplot Desktop Solutions (1:46)
- Why use Tecplot 360/Focus with Excel? (2:29)
- Agenda – Using Tecplot 360 with Excel (4:32)
- Introducing the Excel Add-in (5:22)
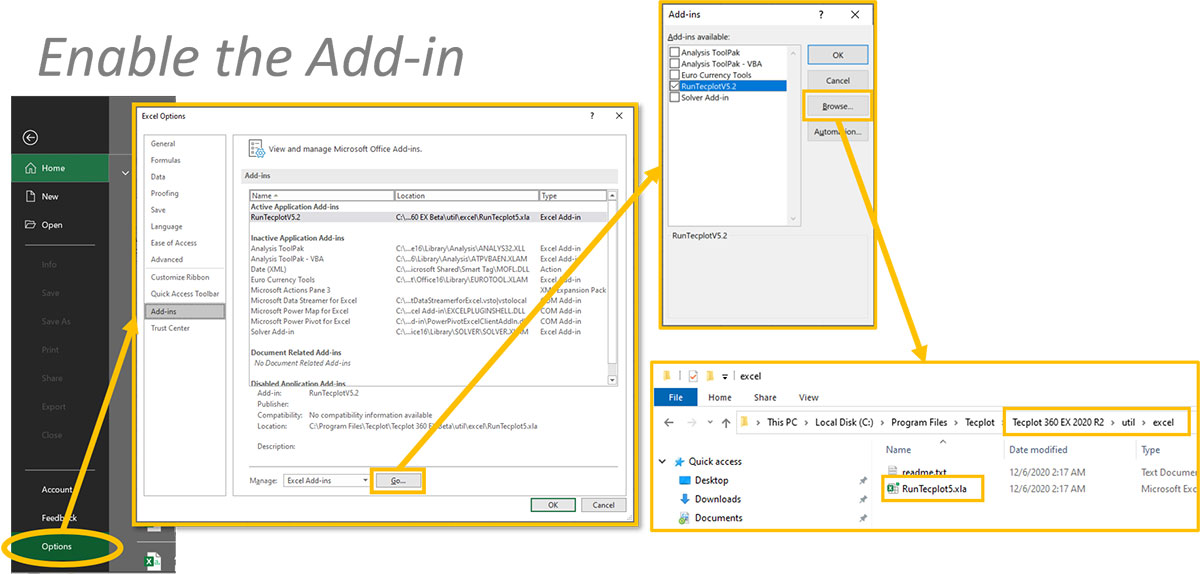
- Enabling the Add-in (6:26)
- Loading Line Data (7:19)
- Loading 2D Contour data (17:54)
- How the Add-in differs from the Excel data loader (25:54)
Q&A Answered in the Video (23:09)
You didn’t show how to plot the temperature with a different number of points? Was it because they were separated? (23:10)
They would show up as separate zones. Therefore, we would need to create a new linemap to reference the zone with temperature.
When you save the layout, where is the source data stored? (24:12)
To save a layout, for example, you need to save the data as a *.dat or *.plt data file and a *.lay file. Alternately, you could save a “packaged layout” (*.lpk). LPK files save the data alongside the layout. See this video on Tecplot file types.
Is there a way to write month as names instead of numbers? (11:54)
Yes, it is possible to load custom labels within Tecplot 360. Have a look at CustomLabels.plt and CustomLabels.lay in the installation /examples/SimpleData folder.
Is there any way to show 5 variables with the same x axis range but different y axis range in only one graph? (29:03)
Yes! You will need to define a different Y-axis. Tecplot supports up to 5 Y-axes! This can get visually complex but coloring the axis lines helps.
On Tecplot contour plots, the legend does not extend to the actual min/max of the data. Is there a way to annotate the actual min/max from the dataset next to the legend? (29:54)
Yes. There are two ways to do this. In the first, use Dynamic Text (check out the Tecplot 360 User Manual). The second way is to reset the contour levels to the actual min/max of the data.
Q&A Answered in the Live Webinar
I have a problem in importing streamline contours from COMSOL.
From my understanding the best way to import COMSOL data is using the VTU format. I’m not sure about streamlines specifically. Go ahead and email support@tecplot.com and we can help you more directly there.
Can you select part of a worksheet to Send to Tecplot, or does the whole sheet go at once?
Yes, you can select part of a worksheet. Additional sheets will show multiple regions.