


 MENU
MENUA new parallel processing toolbox for PyTecplot has been developed … reducing the postprocessing time by a factor of 12 …
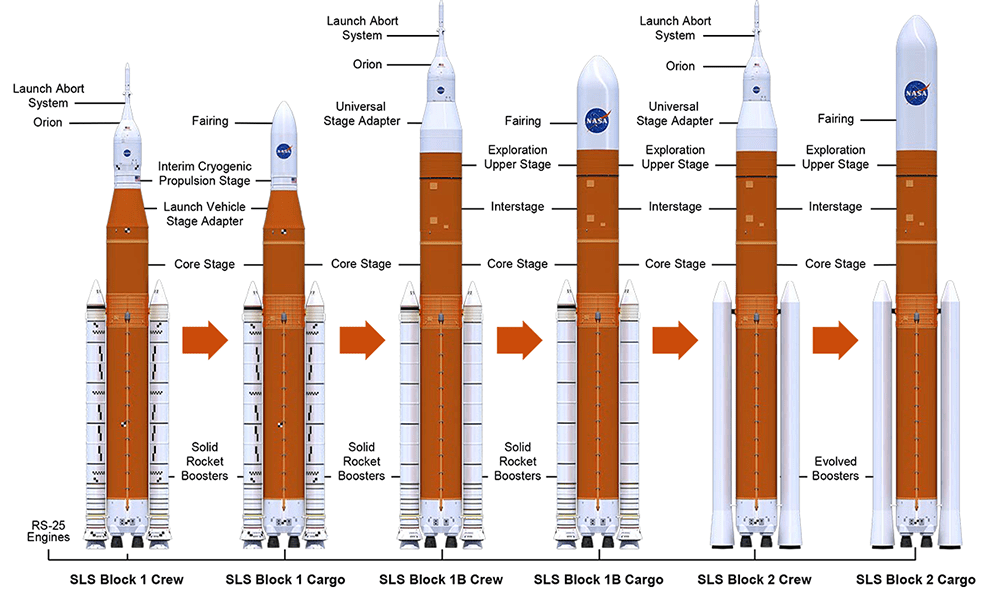
Figure 1. SLS Configurations
Analyzing Wide Range of SLS Flight Conditions
Aerodynamic support for the SLS requires the use of both wind-tunnel tests and computational simulations to develop aerodynamic databases across the flight mission profile, seen in Fig. 2. These data are generated for a range of flight regimes including launch, liftoff, ascent, and booster separation. Flight conditions for the SLS vary from low-speed conditions on or near the launchpad to supersonic speeds during ascent. Because of this wide range of flight conditions, numerous tools are required to accurately capture the properties of the complex flowfields that evolve over time. While experimental results are useful and necessary, computational simulations yield results at flight conditions not easily tested in a wind tunnel facility, and these results include some fine-scale details that are not measurable in a wind tunnel.
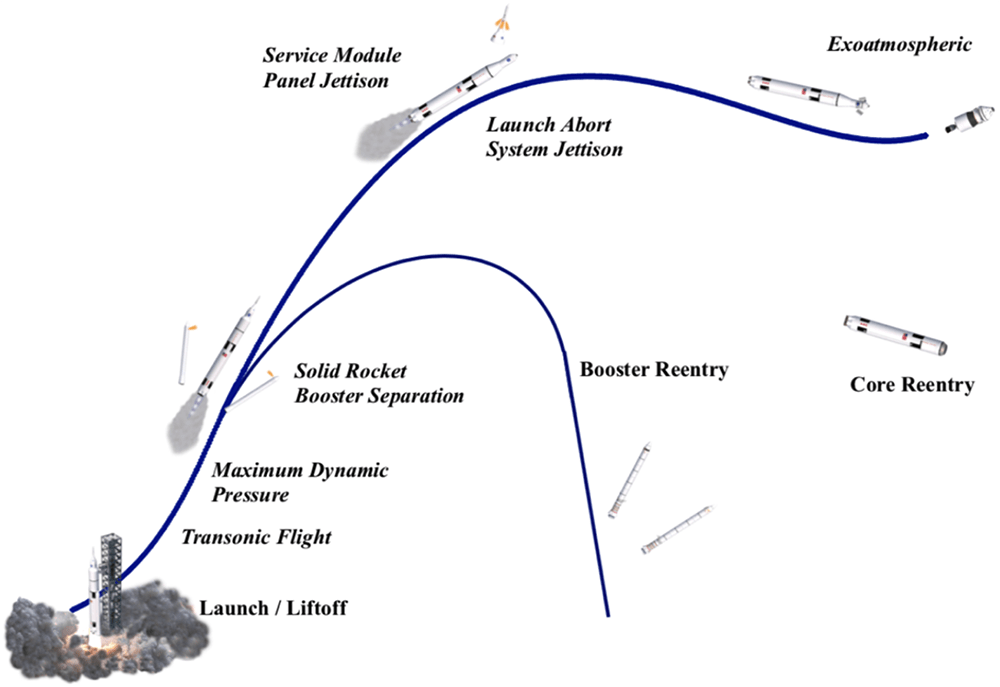
Figure 2: SLS mission profile.
Unfortunately, the data files from which the animation was extracted are extremely large, often being in excess of 10 terabytes of data, even when saving just a subset of the simulation data. Consequently, reduction of these data is time intensive from both human and computational perspectives, to the point where it is prohibitive to employ these techniques as an everyday tool for database-level analyses.
12x Reduction in Postprocessing Time with PyTecplot
In collaboration with Tecplot developers, a new parallel processing toolbox for PyTecplot has been developed and implemented to reduce the aforementioned datasets. Use of these new methods has reduced the postprocessing time by a factor of 12 relative to the baseline reduction methods. These newly-developed parallel data reduction routines reduced the time to make a movie, such as this one, from days to hours, thus enabling analyses across a much wider range of flight conditions.
More information on Artemis and SLS can be found on the NASA website.
Learn more about PyTecplot.