


 MENU
MENUEvery scientist or engineer is, at some point, going to have to present their findings based on their simulations or experiments. In earlier posts, we discussed several tips and tricks for making your plots and presentations as effective as possible by tailoring for your audience, using consistent conventions, and avoiding common pitfalls, but what about the flow or narrative of your presentation? How can you use the work that you performed to tell a story about the problem, your analysis, and your conclusions? Storytelling makes us think of creativity, and the skills to become a good storyteller seem to us to be mostly innate, abstract things that are difficult to learn or define, but that is not always the case. Let us talk about some basic steps you can take to tell a story in your technical presentations – keeping in mind that the exact parts or sequence may vary depending on your situation.
1 – Introduce the Feature, Part, Subsystem, or System in Question
First, especially if you are presenting simulation results, is to make sure the audience understands the context of your model. What feature, part, or subsystem did you analyze and how does it fit into the bigger picture? Valuable context might help the audience understand things like the location, geometry, or function. An easy example of this might be if you are performing a structural analysis of a turbine vane – to provide context you could show a cutaway rendering of the relevant turbine stage with the analyzed component highlighted. Similarly, if you were performing trade studies on the filet radius of the same turbine vane – the contextualizing image may simply be of the entire vane with a close-up or highlight of the subject feature. A good rule of thumb is to show or describe how the relevant zone fits into the next level up – but as we have discussed in earlier posts you may wish to add context depending on your audience.
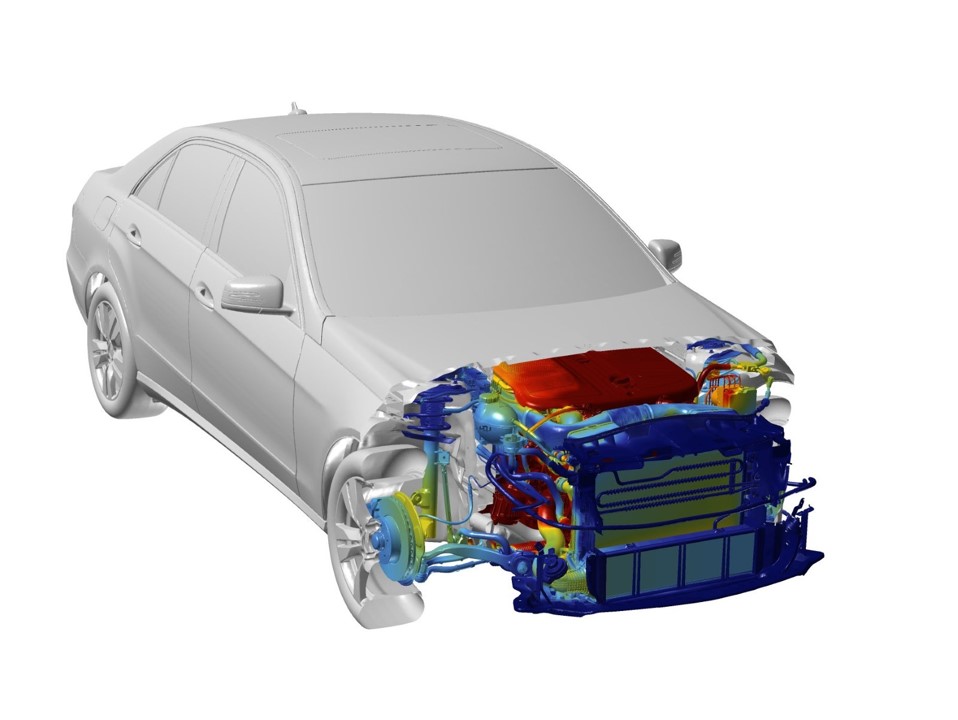
Figure 1 gives context for an internal airflow analysis of a sedan by showing a cutaway of the exterior and highlighted internals. Image created in FieldView.
2 – Explain the Problem, Goal, or Question
Next – it is critical to explain the purpose of your experiment or analysis. What were you seeking to discover, prove, or quantify and why? Your problem statement may benefit from an additional visual aide, or perhaps the context you provided earlier will suffice. If your analysis is of a component that has had reliability issues in the field, you might first explain the nature of the reliability issues and show a photo of the failed component, and then state that the goal of your analysis is to identify the root cause of the problem and design a remedy. If you are presenting a set of wind tunnel data on a subscale aircraft model your goal may be to validate CFD results used in the design process. If you’re a climate scientist – you might be trying to answer the question – what happens if we don’t reduce our GHG emissions by 20XX? In any case, explaining the ‘why’ (also commonly referred to as the ‘motivation’) is an essential element in telling a story.
3 – Summarize the Approach to Generate, Measure, and Reduce your Data
The stage has been set, the characters have been introduced, and now it’s time to let the plot unfold. This next section may be a couple, or a couple dozen, pages long depending on how complex the work was. You’ll want to explain the pre-processing steps taken, the assumptions you’ve made, and the calculations that were used. A CFD engineer, for example, might explain the source of the geometry, show the computational mesh that was created, and outline the boundary-conditions, flux-functions, limiters, and turbulence models chosen. Depending on the purpose of the presentation, they may also wish to explain the computational environment that was used. You still haven’t presented any results or answered the opening question(s) – but you’re building confidence that the results you are about to present are meaningful.
4 – Present the Results, Highlighting Key Trends & Conclusions
The climactic ending is what you would expect – presenting the results. All too often one is tempted to skip right to the goods, but as we’ve discussed above, the work you’ve done to get to this point is critical to making your story clear & believable. The way you present your results matters, and the results you choose to present (or to save as ‘back-up’ slides) matter as well. We won’t reiterate the specifics here – but this section is your chance to showcase all the hard work you’ve done, so make it look good and make it relevant.
So there you have it – a beginning, middle, and end. And here you thought that the elements of a story were something you could forget about after your senior literature courses in high school… True, a traditional story has 5 elements (setting, characters, plot, conflict, & resolution), but we didn’t think it was necessary to stretch the analogy that far ????. Regardless of how you count, telling a story about your project is a worthwhile habit to cultivate that will make the impact of your work more effective.