


 MENU
MENUIn this video I will show you how to add streamtraces to your plot.
Streamtraces use the UVW vector variables in your plot and can be added easily with just a click and drag using the Streamtrace tool. The default adds ten streamtraces in what we call a rake. You can also single-click to add individual streamtraces. These are volume line streamtraces. You can see in this view that the streamtraces go above and below the slice. They are not restricted to the slice, by default.
Displaying Volume Lines, Ribbons, and Rods
Learn more in the Tecplot 360 User’s Manual, Section 15 Streamtraces
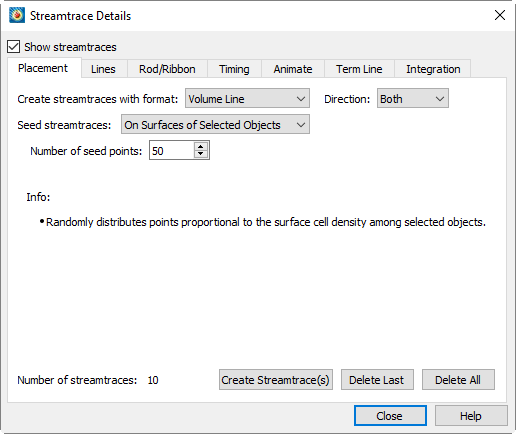
When I open the Streamtrace Details dialog, you can see that we have a several different types of streamtraces. Volume lines, volume ribbons, and volume rods are going to go through volume data. The Surface line streamtrace is surface restricted, which means it must be added to a zone. Because this is a slice, we can’t restrict streamtraces to a surface. If you want to restrict it to a surface at this location, you need to extract that slice to a zone and then add the streamtrace to the zone.
Now I’ll demonstrate each streamtrace type. First, select Volume Line, grab the placement tool, and single-click to add the volume line. Then do the same with the volume ribbon and volume rod. Zoom out to look at the slice (control right click to rotate, middle mouse to zoom). Now you have a better view of each of these objects.
- The volume line is simply a line with rendered arrowheads. You can see some arrowheads dip and dive, but they’re obscured by the slice.
- The volume ribbon is a flat object.
- The volume rod is a 3D shape which is three points by default.
Customizing
Select the Rod/Ribbon tab to adjust the number of points. I can make volume rod look rounder by adding more points. But three points is good because you can see any twist in your flow. The width can also be adjusted. If I increase the width, both rods and ribbons are affected. I can change the coloring. Now it’s colored by density. If I turn off the slice, you can see the rods and ribbons better.
Animating Streamtraces
Now let’s animate these streamtraces. We are animating at the individual time step, instantaneous velocity in this case. When you’re done animating, the streamlines stay in a mode that shows what we call timing markers and dashes. If you go to the Timing tab, the markers can be turned on and off for the volume lines. Dashes affect all three streamtrace types.
Occasionally you may have a very slow region of flow, and your streamtrace may stop prematurely. In this case you can use the Integration tab. Adjusting the minimum step size or increasing the number of steps that a streamtrace takes across a cell will allow a streamtrace to propagate through a very slow flow.