


 MENU
MENUDefining Isosurfaces Using the Contour Details Dialog
Read more about defining isosurfaces in the Tecplot 360 User’s Manual
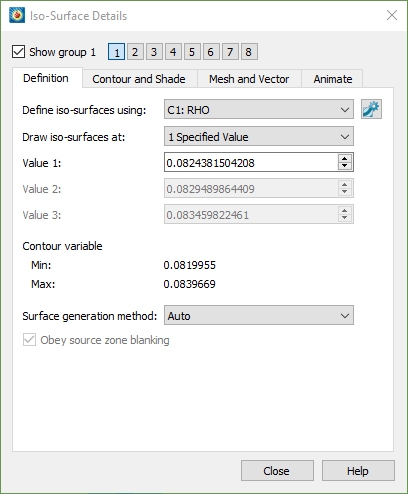
Open the Isosurface Details dialog to view the options. The isosurfaces use the existing contour groups (defined in an earlier video). Tecplot 360 will default to the first contour group, which in this case is salinity.
Create a new contour group by clicking the contour details group 2. We can change to the second contour group, click the details button to open the details dialog. Rather than looking at the latitude, which is selected by default, let’s change it to this variable called siglev, which is a range from zero to minus one. It gives us information from the surface to the sea floor and is a clean way to plot the bathymetry of our dataset. I’ll keep the remaining defaults for siglev because we’re not interested in changing the color map for that. We just want to change the definition for the isosurface using this contour group. I’ll change the Draw iso-surfaces using: to specify values of zero at the surface and minus one to the sea floor.
Turning on Isosurfaces
I’m doing this because as I rotate the plot, when the contour is toggled on for the entire zone, it wraps around and cuts off the view inside the fluid volume so we can’t see what’s happening in there. We’re only seeing what’s happening on the exterior. I will toggle off the zone layers (Mesh, Contour and Shade) to clean up the plot and then toggle on Isosurfaces. What we see now is the value at zero and the value at minus one – showing the surface and the sea floor. We also get a peek into the fluid volume to see the bathymetry. Then we can use this view for adding additional derived objects like slices and streamtraces to get even more information.
This wraps up this example of defining an isosurface using the contour details dialog box. Thank you for watching!