


 MENU
MENUMost of you know by now that in 2019, FieldView CFD was acquired by the same operating company that owns Tecplot, Inc. – effectively turning these erstwhile enemies into siblings.
What you may not know, is that beginning on January 1, 2022, FieldView (the product) will be tucked in underneath Tecplot Inc.’s umbrella to sit alongside our other post-processing products (360, RS, and Focus). Now we’ll have two teams working together as a single, strengthened organization – with perks for our customers like a unified customer portal, harmonized licensing policies, one place to purchase from, and one place to look for product support. With this change there has been some confusion, even incredulity, and not just from the outside. Housing competing software tools (namely, FieldView and 360) under one roof can lead to lots of tough questions, questions like: “Which one are you going to kill?”, “If I own one do I get access to the other for free?”, and, lastly, “What the hell!?”
Before we move on – to answer the first couple of questions… Do not worry! We are not going to “kill” either FieldView or 360 – both are valuable to our customers, and therefore, to our business. And, sorry… (not really), you do still have to pay for each separately.
Tecplot Inc., has been around in one incarnation or another for 40 years under various names. Wow, that is as old as the compact disc. FieldView has also been around a long time, for a solid 30 years, which makes it a few years older than the illustrious DVD. But, unlike outdated modes of media technology, 360 and FieldView have continued to stay relevant through year after year of software releases – always improving their code-base and squashing bugs. Both products continue to adopt modern technologies, add new features, and integrate with new tools in the science & engineering ecosystem.
Both 360 and FieldView share a lot of common features and strengths. They can each be used to analyze and visualize scientific data, especially CFD data, from a wide variety of sources. They are both extremely reliable, have impressive backward compatibility, unmatched technical support, and are easy to use. Additionally, both FieldView and 360 have been highly tuned for speed and efficiency on data sets of all sizes.
But to answer the last question, which could be politely paraphrased as “What sense is there in that?”, let’s look at when and why would you choose one tool over the other, or even choose both. To do that we want to look at the unique strengths of 360 and FieldView; where do they stand apart?
360 is particularly good at:
XY plots
Big whoop, right? We all drew XY plots on graph paper during our math & engineering courses. It’s (almost) 2022, 2D is easy! Right? Well… sort of. The thing is, 360 is the best in the business at extracting the data you want from a simulation (usually 3D) and allowing you to make exactly the right plot with it. XY plots aren’t a marvel of modern rendering, and they don’t make the sexiest marketing materials, but most engineering decisions are made with XY plots – so that is something we designed 360 to help you do better than anyone else.
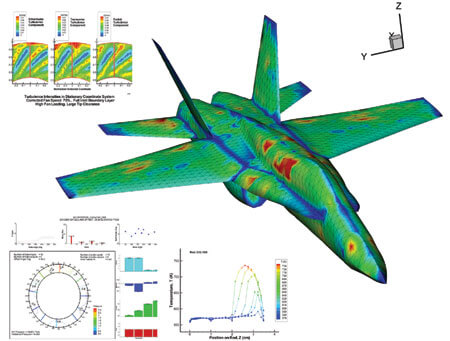
Put your 2D extractions alongside your 3D plots for the best of both worlds
CFD Analyzer
360’s CFD Analyzer capability is another feature that makes it stand out. We purposefully avoid referring to 360 as a “visualization” tool, because to do so would be to downplay the importance of the analytics capabilities we’ve built in. CFD Analyzer is a fantastic toolkit for the aero engineer who wants to compute forces & moments, add or change reference values, and much more. If the convenience of a built-in set of aero analysis functions is appealing for your work, 360 has you covered.
PyTecplot
Last, but not least, is 360’s best-in-class Python API, PyTecplot. True, scripting in Python isn’t everyone’s cup of tea – but if you’re willing to take the time to learn the API it can unlock a whole new world of analysis & visualization potential. To help you learn the API we’ve included the ability to “journal” your actions within the GUI – which creates a script of your actions that you can refine & repurpose. PyTecplot doesn’t just increase the capability of 360, it also can accelerate the performance of the code by enabling distributed parallel processes. If workflow automation with Python is particularly important to you – consider using 360 for your post-processor.
FieldView, on the other hand, excels at:
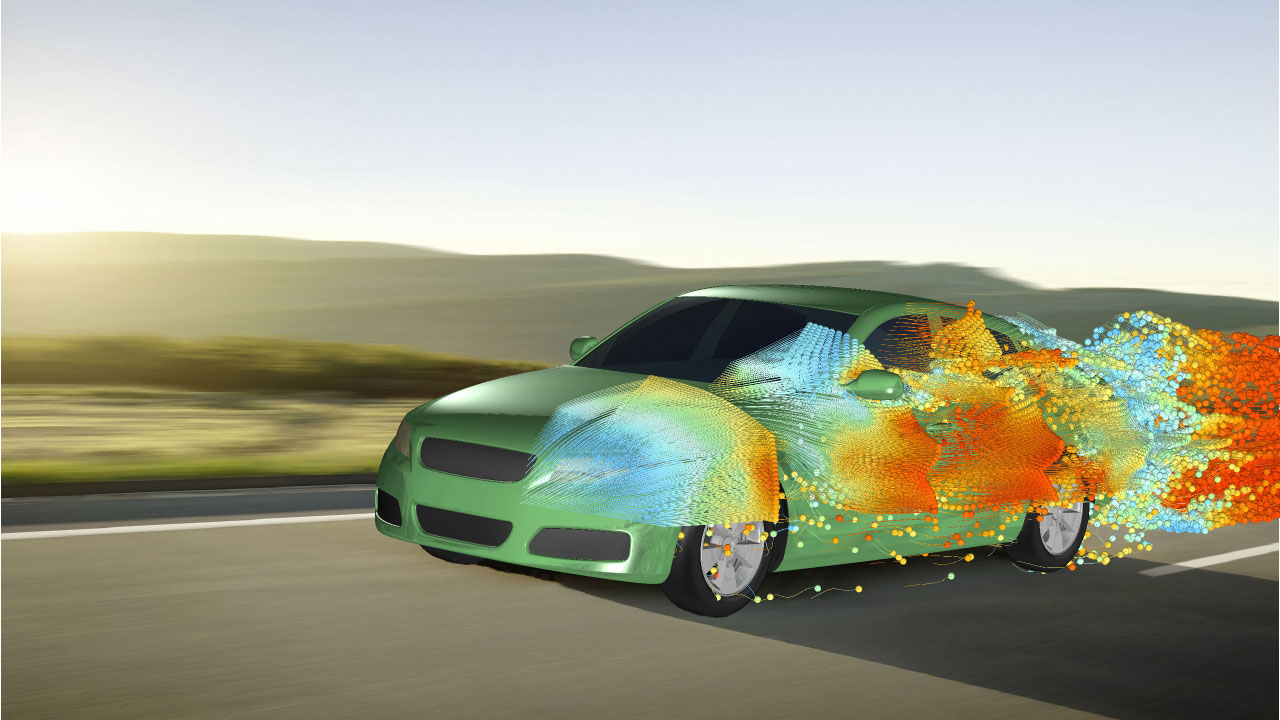
Material Rendering
FieldView’s material rendering feature makes it easy to produce beautiful images of your 3D analyses. Advanced lighting controls can be the thing that saves you from producing a plot that looks like a drawing out of MS Paint. If you need to make an impact with your CFD visualizations, don’t overlook FieldView.
Client-Server Architecture
We are well into the information age, but still some tools overlook the importance of where the information resides. FieldView’s client-server architecture allows engineers to access data wherever it is best stored, but without losing the smooth interface experience of a local application. If you are routinely running large CFD jobs on an HPC resource and cannot afford to download the data every time, but you prefer to do your post-processing on a local machine, FieldView can make that process supremely smooth.
MPI Parallelism
FieldView’s MPI parallelism is clutch when solution files get extremely large and a single machine’s memory becomes insufficient. You can distribute your job across multiple nodes, mitigating the risk of running out of memory, and simultaneously accelerating the speed of your data & rendering operations. The latest release of FieldView (FV21), added a powerful new ‘auto partitioner’ that can help distribute operations for unpartitioned or unbalanced grids. If your grids are bigger than big, you might benefit from FieldView’s MPI architecture.
Conclusion
So, there you have it, depending on the data type, workflow, and desired output you’re dealing with – either 360 or FieldView make an excellent choice for post-processing. They can even be used side by side to produce different plots & analyses from the same set of data, something we’ve seen quite a lot of at many of our customer sites. If you’re a power user of one tool and would like to learn more about the other, or if you’re new to both, please reach out to us for a demonstration!