


 MENU
MENUAt blueOASIS, Tecplot 360 is an essential tool for Making the World Green and the Oceans Blue. Either in the CFD simulation of offshore energy harvesting devices (wind, wave and current) and their impact on the maritime life; or other projects such as:
- Analyzing naval vessels and alternative ship propulsion systems
- Investigating ocean cleaning devices
- Studying and optimizing offshore floating platforms for multiple purposes
All our Renewables and Ocean Sustainability projects generate large amounts of raw data which require an efficient, yet powerful tool to generate comprehensive, easy interpretable and fine-looking results. Our tool of choice is Tecplot 360.
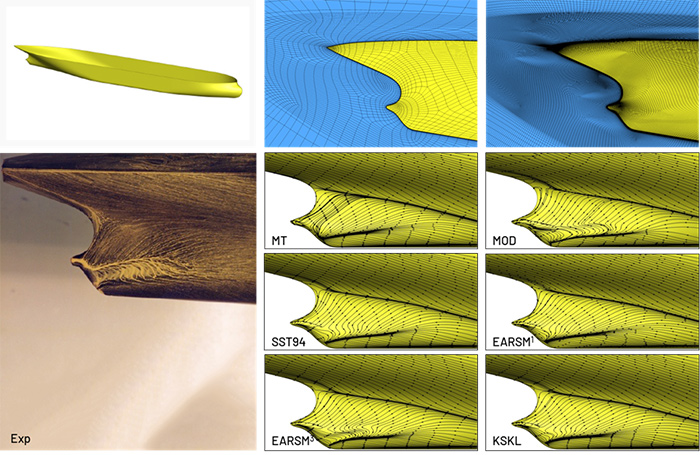
Figure 1. Maritime & Naval applications: validation of limiting streamlines vs experimental data for a model-scale KVLCC2 ship. Effect of turbulence modelling (reference).
The engineers at blueOASIS have gained 20 years of experience using both open-source and commercial visualization packages, and still use both types of tools. But one of the key advantages of Tecplot 360 is the simplicity and intuitive character of its graphical user interface (GUI), which enables new users to quickly start using it. Another feature that sets Tecplot 360 apart from other solutions is its scripting capabilities using the Python API. PyTecplot provides a platform for simple scripts that can be executed within the GUI or in batch, which harness the full functionality of the software in streamlining complex workflows, saving valuable time in projects.
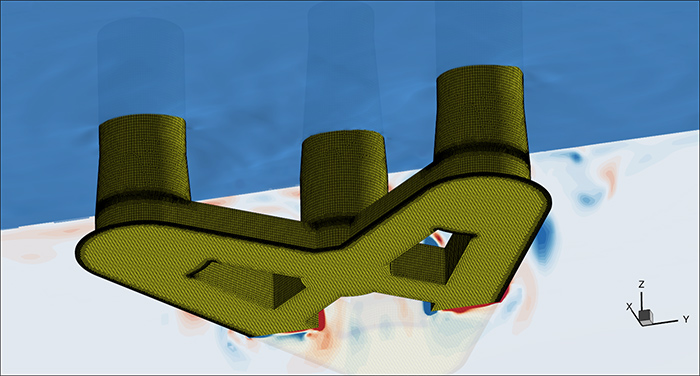
Figure 2. Renewable Energy: simulation of a floating offshore wind platform. Surface grid, free-surface iso-surface and vorticity distribution at symmetry plane.
Obviously, Tecplot 360 also excels at data visualization; It provides control and flexibility over the resulting image, vector, or animation in a user-friendly manner. Multiple views of the same data are easily set-up using separate frames, which can be either independent or dependent from one another and are fully customizable. Another advantage of Tecplot 360 is having several visualization modes, including XY plots, which can be easily overlapped and even time-synchronized with regular 2D/3D views. These functionalities enable the creation of data-rich graphics, suitable for reports and presentations.
Renewable Energy Video: Simulation of a free-floating offshore wind platform. Geometry, free-surface iso-surface colored with x-velocity component. It includes platform attitude time history xy plots.
Tecplot 360 Simplifies Tedious Tasks
The crucial CFD-oriented operations embedded into Tecplot 360 are vital for our Renewables and Ocean Sustainability projects. Tasks that are tedious and unreliable in open-source tools are simplified and reliable in Tecplot 360. One example is the easy calculation and setup of surface limiting streamlines (or shear-stress lines). Because this is an important fluid mechanics feature to analyze flow patterns, recirculation and separation areas, and drive geometry optimization, it is just one of the many crucial features for any CFD practitioner. But there are more examples, such as one-button contour plots with colors and lines, tangent vectors in slices, arbitrary slice shape creation, volume streamlines control and accuracy, memory management, and more.
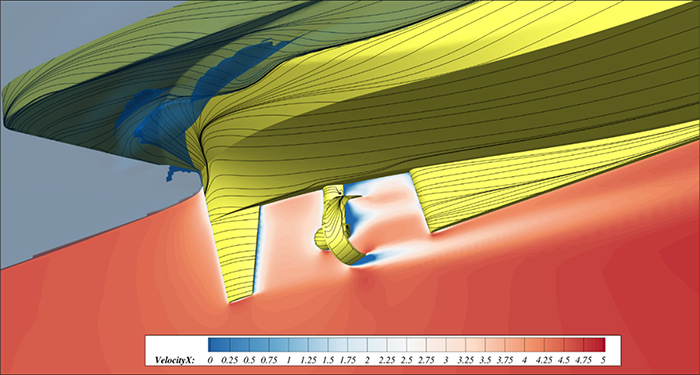
Figure 3. Maritime & Naval applications: simulation of a propelled appended ship including free-surface effects. Geometry, free-surface iso-surface, slice at symmetry place of the x-component of the velocity field and surface limiting streamlines.
Moreover, the easily accessible online tutorials and training sessions enable us to continuously learn more on how to fully take advantage of Tecplot 360’s functionalities. blueOASIS uses both open-source tools and Tecplot 360, which means we can combine the best features of both worlds. Currently, we are working on the coupling between Tecplot 360/PyTecplot and Blender, a popular high-level rendering open-source tool, to create (even) more realistic pictures and animations.
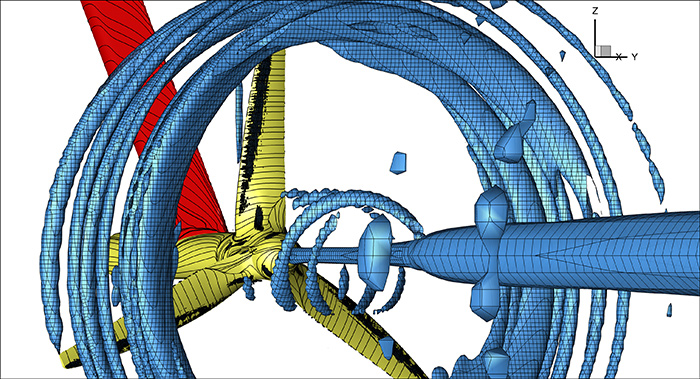
Figure 4. Current/tidal turbine: limiting streamlines and q-factor iso-surface showing the cells used.
All in all, Tecplot 360/PyTecplot is the preferred choice of blueOASIS’s for data treatment and visualization in Renewables and Ocean Sustainability projects, since it provides a complete and efficient sustainable solution on our quest to seek new solutions for old problems.
Blog submitted by:
- Guilherme Beleza Vaz, R&D Manager/ CFD Developer
- Tiago Gomes, Research/CFD Developer
Learn more about blueOASIS