


 MENU
MENUComputing statistics over time, such as averages, average deltas, minimums, and maximums, are important methods in CFD to understand trends in turbulent flow fields. In this video, we will demonstrate PyTecplot scripts that can be used to calculate these quantities.
Computing Time Average
We will start by computing the time average of the VortexShedding.plt example, a 2D transient data set found in the Tecplot 360 installation directory in the examples folder. The data has a common grid throughout time, so we could use the Specify Equations dialog to manually compute the average, but this will quickly become tedious. Instead, we can utilize the TimeAverage.py python script which will create a new zone with time-averaged quantities automatically.
Python Prerequisites
This script is located on github.com/Tecplot, but to take advantage of this script, we need to take care of a few prerequisites:
- First, we need a 64-bit version of Python 3 installed, which is downloadable from https://www.python.org/downloads/
- Next we will need to install PyTecplot. Installation instructions are available on our website in the PyTecplot Documentation. It should be as easy as typing: ‘python –m pip install pytecplot’ in a command line. If you don’t have administrator privileges, you may also need to include the ‘–user’ flag: ‘python -m pip install –user pytecplot’.
- If you do not have our GitHub python scripts cloned locally, click the “Raw” button in the GitHub script to easily select all the code, and copy it.
- Then paste the contents in a blank text file and save it as a python script with the file extension “.py”.
- Make sure to also save tpmath and tputils in the same location as the .py script, because they are used in the script and required for it to run.
Run Script in Connected Mode
Once these prerequisites are fulfilled, to run the script in connected mode:
- Launch Tecplot 360
- Load the data set [VortexShedding.plt]
- From the Scripting dropdown menu select “PyTecplot Connections…” and toggle on “Accept connections”. This allows the Python script to connect to the currently active session of Tecplot 360.
- Next, open a command line.
- Navigate to the directory where the .py script is saved.
- And run the script by entering:
python TimeAverage.py
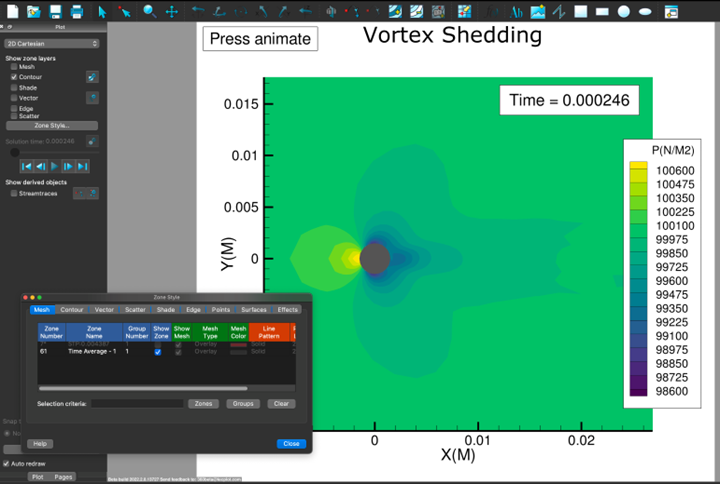
We will then be prompted for which time strand we want to average. Enter 1, and press Enter to continue running the script.
The time strand number can be found in the Dataset Information dialog and is simply an integer which identifies a collection of zones through time. The script will now handle the zone duplication and execution of the formulas to average the results.
When the script is finished toggle off the original Zones and toggle on the Time Average zone to view the results.
Divergence from Time Average
Sometimes, it might be useful to study the divergence from the time average at each time step. If you want to create delta variables from time averaged variable quantities per time step, that can also be performed using the Time_Delta_vs_Time_Average.py python script, also available on our GitHub. You can save this script locally using the same steps shown previously.
Run the script from a command line by entering:
python Time_Delta_vs_Time_Average.py
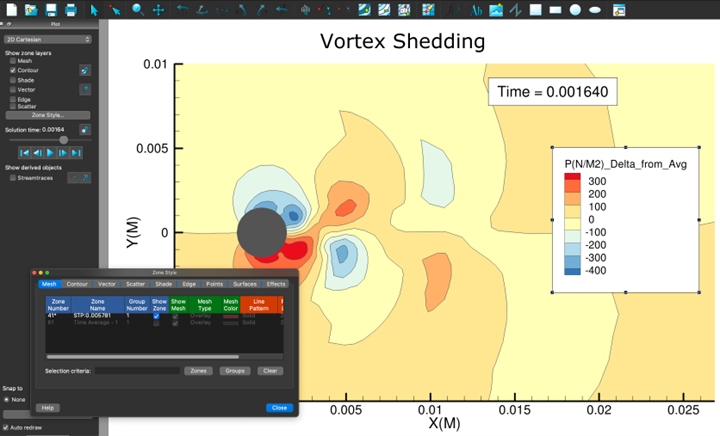
This will create new delta variables for the data set.
After the script has completed, update the contour to one of the new variables of interest, change the color map to a diverging color map to better visualize the time-averaged delta and also verify that the contour levels are symmetrical.
Creating Min/Max Plots
Creating min and max plots is also possible using the TimeStats.py script, which is also available on our GitHub.
This script will capture the minimum and maximum value through time at each point of a constant mesh. The result will be two new static zones, one with all the minimum values of the mesh from all time steps, and another new zone with all the maximum values of the mesh from all time steps.
Notice that after running the script, the Zone Style shows both the Minimum and Maximum zones. Toggle-on these zones individually to see the results.
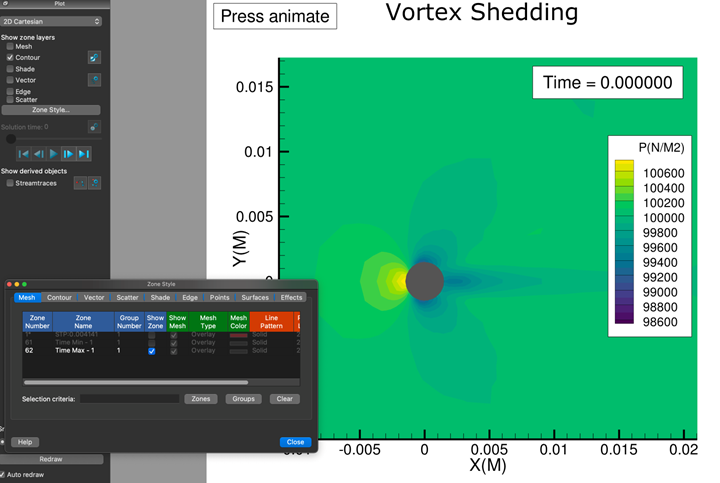
Max
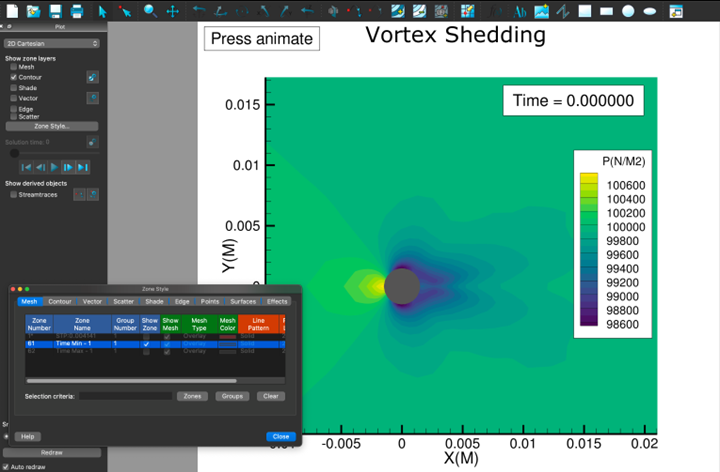
Min
For all these examples, we ran the scripts in connected mode to visualize our results in the Tecplot 360 GUI. However, these scripts can be modified to run in batch mode for improved performance.
This concludes the tutorial on running PyTecplot scripts for visualizing transient data statistics in Tecplot 360. Thank you for watching!