


 MENU
MENUNew York Yacht Club American Magic “Patriot”: Aerodynamics Flow Visualization
The New York Yacht Club American Magic team utilizes Tecplot 360 as part of their aerodynamic workflow to aid in visualizing solutions from Altair Hyperworks CFD with AcuSolve. With the performance of an AC75 yacht depending on the balance between aerodynamics and hydrodynamics, design trade studies are key. In this case study, Tecplot 360 is highlighted as a powerful CFD post-processing and visualization tool.
The performance of an AC75 yacht when sailing on her hydrofoils is governed by the balance between the aerodynamics of the sails and hull against the hydrodynamics of the foils. As the aero forces are the engine of the yacht, a good understanding of design variations is critical.
American Magic uses Tecplot 360 to visualize the CFD solutions they produce within AcuSolve from Altair. Tecplot 360 is ideal for this task because it can be easily scripted and creates standardized output. As a result, the aerodynamic study of the yacht has been split into two distinct simulation workflows.
Generating Aerodynamic Data
The first workflow is generating aerodynamic data to feed into the velocity prediction program (VPP). For that, American Magic engineers run thousands of simulations to define the forces and moments over a range of input parameters. At every condition they output a standard package of flow visualization images using PyTecplot scripts (360’s Python API). This workflow allows the team to efficiently manage the high volume of solution data by down-sampling to image files which can be referenced later should the team see something interesting in the results.
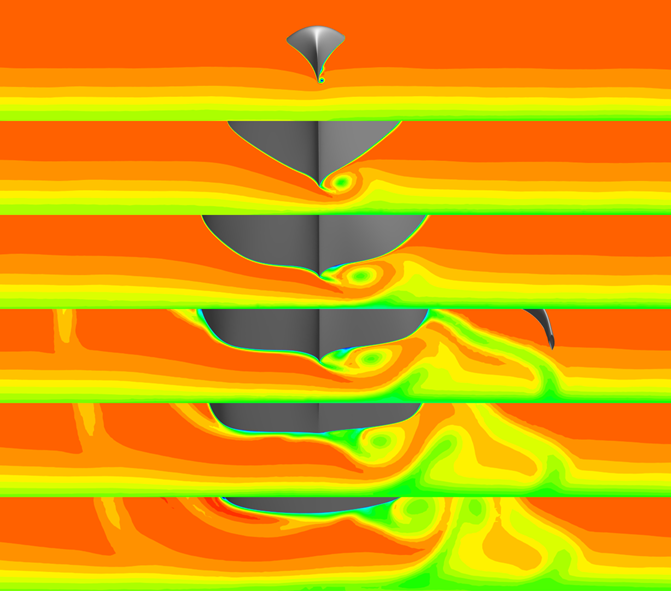
Total Pressure slice planes plotting the transverse flow (left to right) of the apparent wind under the hull.
Trade Studies of Design Variations
The second workflow is more detailed trade studies of design variations. This sometimes requires a deep dive to visualize specific flow features. One example of a detailed analysis involves a PyTecplot script (provided by the Tecplot Support team) to plot and visualize the distribution of force components along the length of the yacht. This graphical overlay allows the aero engineers to better understand the impact of geometric changes.
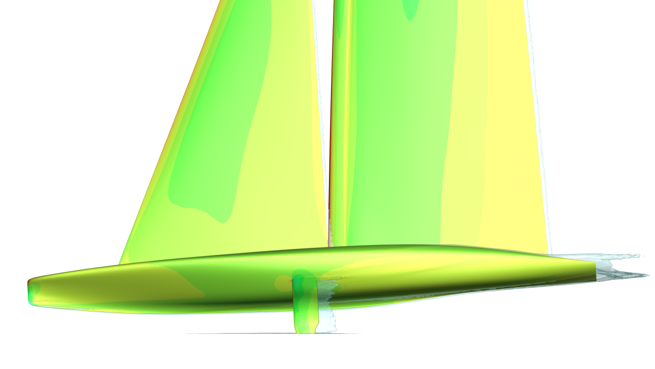
Pressure Coefficient plotted with Total Pressure isosurface on the leeward side of the yacht.
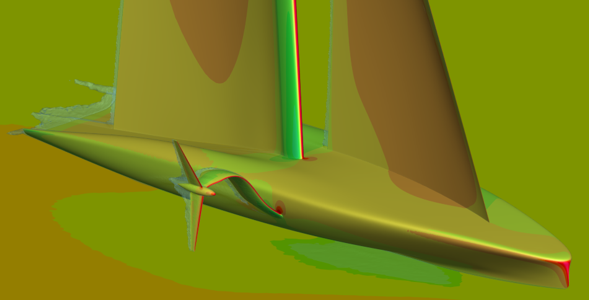
Pressure Coefficient plotted with Total Pressure isosurface on the windward side of the yacht.
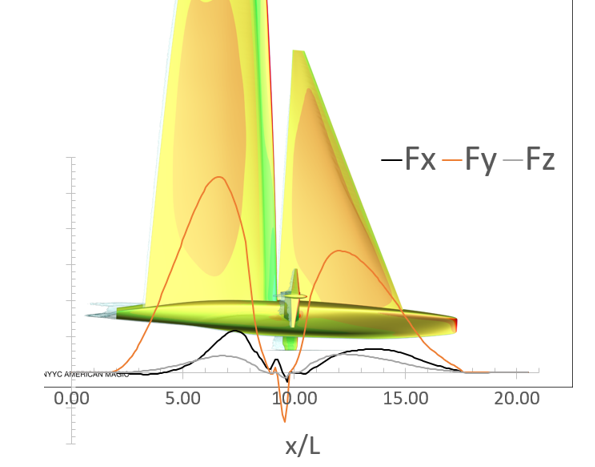
Longitudinal sectional loading of the yacht extracted with Tecplot developed PyTecplot script, plotted over a Cp plot of the windward side.
American Magic – Summary
American Magic uses Tecplot 360 throughout their aerodynamic design process for the AC75 yacht. 360 can generate large numbers of images during the creation of an aero database. These images are a key enabler for identifying and understanding cases of interest.
But 360 is not just for visualization of results; it is also a powerful analysis tool. Later in the design process American Magic uses 360’s Python API to do a detailed analysis of specific designs. Overall, Tecplot 360 is a capable and flexible tool for post-processing and visualizing CFD data, aiding in the understanding and improvement of the performance of the AC75 yacht.