


 MENU
MENU


What’s New in Tecplot RS 2025 R1
Release Date: December 11, 2025
Tecplot RS 2025 R1 delivers significant workflow upgrades—making it easier than ever to manage, explore, and understand your reservoir simulation results.
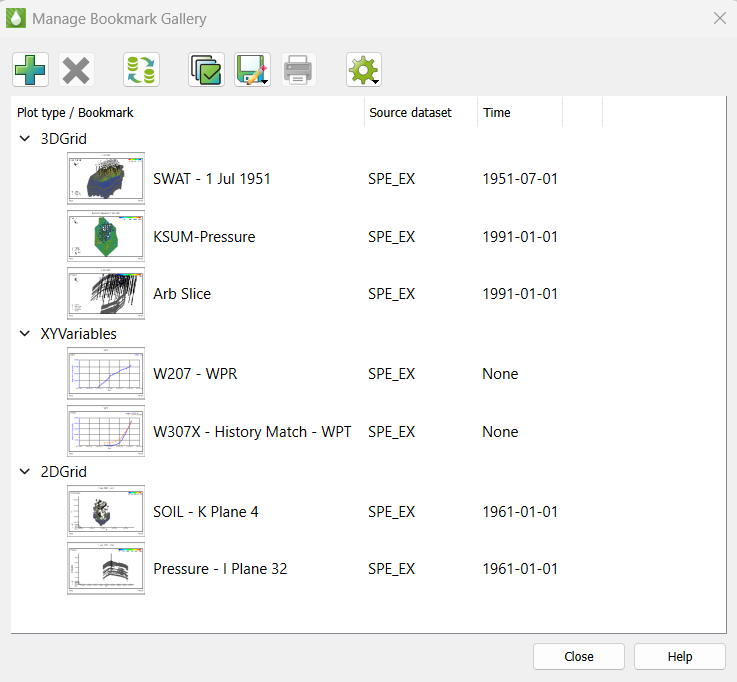
A Smarter Way to Organize Your Work
The redesigned Bookmark Gallery (formerly Plot Gallery) introduces an intuitive, thumbnail-driven view of your saved plot states. Instantly recognize the timestep and dataset behind each view, and keep your work organized with integrated swap-file management—all in a single, streamlined interface.
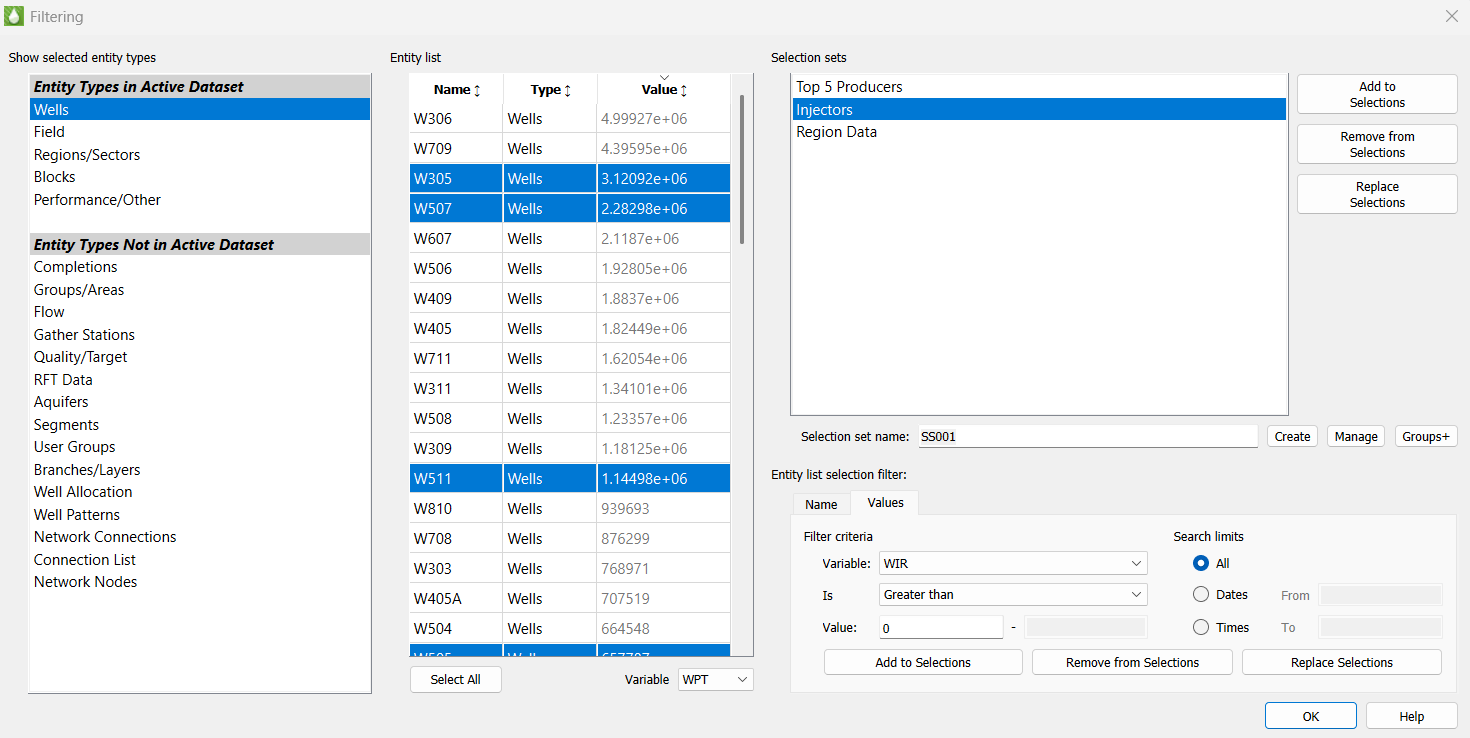
A Modernized Filter Experience
We’ve completely redesigned the Filter dialog to help you build selection sets with confidence and speed. Enjoy a cleaner, more responsive UI; richer entity-type metadata; and powerful built-in tools for creating groups, patterns, and branches without ever leaving the filter workflow.
More Simulation Support. More Flexibility. More Power.
Tecplot RS 2025 R1 expands support for today’s leading simulators, including fault definitions from INTERSECT and CMG MINC grid compatibility. You’ll also get enhanced grid-style options—such as displaying lines and contours together—and the ability to export data from every Quick Plot type, including histogram, cross-plot, time/history, depth, and well-path.
This release also includes a range of performance improvements, bug fixes, and interface refinements that make Tecplot RS more reliable and more enjoyable to use.
Designed for Clarity. Built for the Future.
Many long-standing capabilities of Tecplot RS now surface through clearer, easier-to-use interfaces—and this is just the beginning. We’re committed to continuing these improvements in future releases to deliver a smoother, more intuitive experience for every customer.
See all updates in the Tecplot RS Release Notes »
Get a Free Trial Update Your Software
RS Benefits
Tecplot RS is an all-in-one XY, 2D and 3D solution for oil & gas reservoir engineers. This one tool helps your team easily organize data results, have confidence in reservoir model predictions, collaborate across teams and communicate results to management. A short learning curve, full technical support and free online training, helps your team get up and running quickly.
Read our Datasheet (PDF).
Load Simulation Data from Many Sources
Efficient methods for loading large data sets and an and easy-to-use interface help you quickly access the views you need to comprehend your data. As a full data visualization and analysis tool, Tecplot RS is compatible with many different sources of data. This industry compatibility makes it easy to standardize your results. It also facilitates cross team communication throughout the organization.
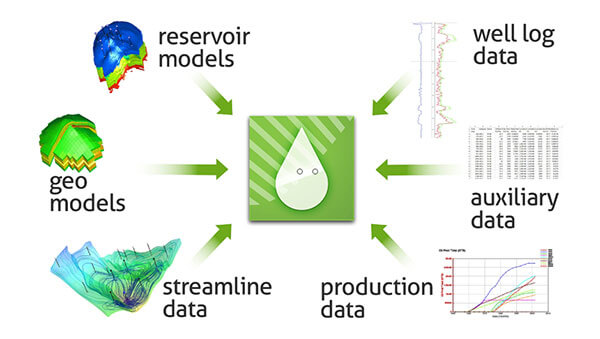
Load data from many different sources into Tecplot RS.
RS Compatible File Formats: ECLIPSE, CHEARS, VIP/Nexus, CMG, VDB, FrontSim, 3DSL, UTCHEM, and SENSOR®, GRDECL, INTERSECT RESQML (explicit grids only). Historical rate, RFT, and observed well pressure data. VDB database format for VIP/NEXUS simulators. Streamline solution data from the VDB format. Streamlines from streamline simulators like FrontSim and 3DSL. User-created ASCII files or CSV. ASCII RFT files from VIP Simulator.
Streamline Processes
Tecplot RS is specifically designed to streamline processes so that engineers get to their answers in just a few mouse clicks. Learn how to use “smart views” in Tecplot RS with these tutorials: Stamp Plot, History Match Bubble Plot and Recovery Map.
“Tecplot RS differs from other visualization packages on the market in several ways. Tecplot RS is easy to use, offers more capabilities, and produces better-quality images, both on screen and hardcopy.” – James Gilman, Director of Engineering at iReservoir
Quickly Validate Your Results
When you have finished running a reservoir simulation, you must be able to quickly validate your results, and make crucial decisions about your model. Visualization and analysis tools are crucial in the simulation workflow to help you fully understand your model.
Working closely with the reservoir engineers over the past 15 years, our team has carefully studied typical reservoir simulation workflows. We have designed Tecplot RS specifically to streamline processes so that you get to your answers in just a few mouse clicks.
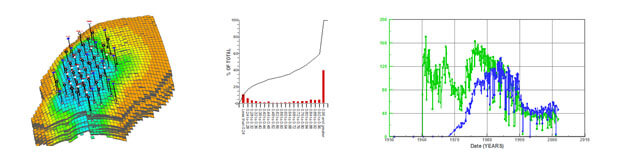
Quickly get fresh insights about reservoir model behavior.
Gain Crucial Insights through Powerful Analysis
Important information extracted from your model can give you fresh insights about reservoir behavior, leading to new discoveries. Tecplot RS has built in statistical analysis tools that pull out detailed reservoir model characteristics, for example, integrating the total oil in place for a grid solution. High quality graphics allow you to view your reservoir from many different perspectives.
RS Documentation
RS Resources
RS Platform Requirements |
|
| Windows Windows requires installation be run as administrator. |
64-bit (x86-64) Windows 11 |
| Linux | 64-bit (x86-64) RedHat 8, 9 SUSE Linux Enterprise Desktop (SLED) 15 Ubuntu 22.04 LTS, 24.04 LTS Rocky Linux 8, 9 |
System Requirements |
|
| For more information, please see our Installation Guide (PDF). | |
Operating System Support |
|
| Tecplot aims to support desktop operating systems (Windows, RedHat, SLED, Ubuntu) that are under standard maintenance by their manufacturers, and are available at the time of the release of a Tecplot product. Tecplot does not guarantee, but may choose to support, platforms which are under an extended support policy, such as Windows “Extended Support” or RedHat’s “Extended Life-cycle Support.” | |
FAQs
Q: What versions of Tecplot software do you currently support?
Technical support is offered to license holders who have a current TecPLUS™ subscription for software releases delivered in the current year and the past two calendar years. Installation-only support is offered to license holders who do not have a current TecPLUS™ subscription for software releases delivered in the current year and the past two calendar years.
Q: How can I get a license key needed to run Tecplot software?
Single-user licenses for Tecplot software released in 2016 or later can be activated with an Activation Code. The Activation Code is provided to you when you purchase or renew your TecPLUS service for a single-user license. Once the Tecplot installation has finished, you will be asked to enter in the Activation Code on your first start-up.
A license key file is required to run Tecplot Software released before 2016, Network licenses, or if you do not have an internet connection.
Q: Do I need to install my license key after I receive it?
Current Tecplot network licenses require an installation of a Reprise License Manager (RLM). Single-user Tecplot licenses do not.
Q: How do I install my license key after I receive it?
After you install your software, you will need to activate it.
Instructions are available in the activation_instructions.html file located in the directory where Tecplot is installed.
Complete details about Tecplot Licensing are available in the Installation Guide for your product. It is also located in the Doc folder where Tecplot is installed.
Q: I installed the trial version, do I need to uninstall it before installing my purchased version?
You do not need to uninstall the trial version. The installation of Tecplot software remains the same regardless of the license type.
Q: If I want to install Tecplot software on a new computer, is a new license key required?
The answer depends on which type of license you have.
Single-user license
If you have a Single-User license, you will need to submit a License Transfer Request from our customer portal, My Tecplot (link at the top of page). Once that is complete you can use your Activation Code to obtain a key for your new computer. If you are not using an Activation code, you can generate a new license key from My Tecplot or by contacting Technical Support.
Network license
If you have a network license, you will not need a new license key. Install your software on the new computer, choose the network install mode, and include your license server name when prompted. Your software should run successfully as long as your license manager is set up correctly.
Q: Can multiple versions of Tecplot software be run on the same computer?
Yes, multiple versions of Tecplot software can run on the same computer. Similarly, Tecplot 360, Tecplot Focus, Tecplot RS can be run on the same computer.
Q: Can Tecplot 360, Tecplot Focus, and Tecplot RS be run on the same computer?
Yes, the products can run on the same computer without conflicting with each other.
Q: Can Tecplot Software be run on a virtual machine?
With a network license, Tecplot software can be run on a virtual machine.
A single-user license key does not allow running on a virtual machine. If you need to use Tecplot software on a virtual machine with a single-user license, please email Technical Support to discuss your situation.
Q: Where do I download the latest software version?
Visit our Customer Portal, My Tecplot at the link in the top menu to access software downloads.
Q: How can I get started using Tecplot RS?
You can start using Tecplot RS by opening the application and loading the sample files provided to see what a plot can look like.
- Open Tecplot RS
- Load example files
- Click the Load XY Data or Load Grid Data button on the toolbar (or choose Load XY Data or Load Grid Data from the Project menu) to open a loading dialog.
- In the Load XY Data or Load Grid Data dialog, Click the Browse button
- Navigate to the examples folder included in your installation (by default on Windows platforms, this folder installs to C:\Program Files\Tecplot\TecRS 2019 R1\examples\). Use the year and version number of your software for the correct directory.
- If you chose to load XY data, choose a unified summary file (*.unsmry), such as chelan.unsmry, to load. Tecplot RS will load that file as well as its related files.
- If you chose to load grid data, choose a grid file (*.grid), such as chelan.grid, to load. Tecplot RS will load that file as well as its related files.
- Use the tools in the toolbar to experiment with the plot.
For other questions and to learn how to use Tecplot RS to its fullest extent, we recommend referring to the User’s Manual or HTML. You can also view this information by choosing Tecplot RS Help from the Help menu.
Q: My license key is not accepted as valid even though I have a valid license. What do I do?
This means that your license key file may not be valid. Please email Technical Support
Q: Where can I get more specific technical support?
» Tecplot’s Support page has a complete list of technical support options.
Q: How much will it cost to upgrade to the newest version if I renew my license?
For customers with a current TecPLUS service, there is no charge to upgrade from an earlier version of Tecplot software. If your TecPLUS has expired, you can request a renewal.