


 MENU
MENUTecplot Chorus has a unique set of features that help you explore datasets from multiple simulations, compare results and evaluate overall system performance. This tool helps engineers who run and generate many simulation or test data sets. The most common applications are:
- Optimizing your designs.
- Developing aero databases.
- Predicting performance over the operating envelope.
- Investigation an engineering problem.
In all these scenarios engineers need to manage their solution data, discover the trends and anomalies in output variables, and understand the underlying physics that cause these variations.
Analyze Parametric Results
Chorus, included* with Tecplot 360, helps you easily analyze from one to a thousand simulation cases at the same time. It incorporates an easy-to-use simulation data management system for both test and computational data. Chorus integrates analysis and quality assurance processes with flexible features that are designed to manage, analyze, and visualize large collections of simulation cases, identify trends and anomalies in performance outputs, and link them to the underlying physics. This can result in more rapid prototyping of design concepts for faster time to market.
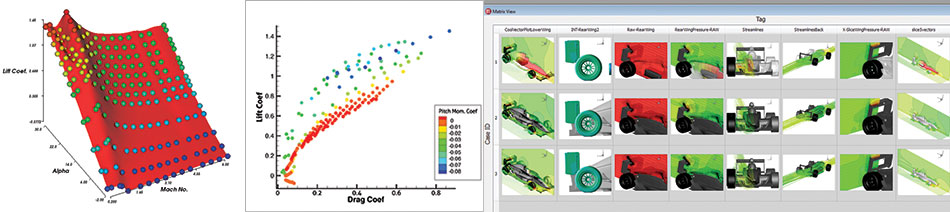
Scatter plot, surrogate model and matrix view. Try Tecplot 360 and Chorus for FREE
Chorus Documentation
User’s Manual or HTML
Getting Started Manual
Platform Requirements |
|
| Windows Windows requires installation be run as administrator. |
64-bit (x86-64) Windows 10, 11 |
| Linux | 64-bit (x86-64) Red Hat Enterprise Linux (RHEL) 7.5+, 8.0+* SUSE Linux Enterprise Desktop (SLED) 15 Ubuntu 18.04 LTS, 20.04 LTS CentOS 7.5+ |