


 MENU
MENUWhen you think you have covered everything – you find that you have not! You asked some important questions during the Getting Started with Tecplot 360 training session using the FVCOM dataset for coastal and ocean modeling. Enjoy skimming the Q&A here to find something of interest.
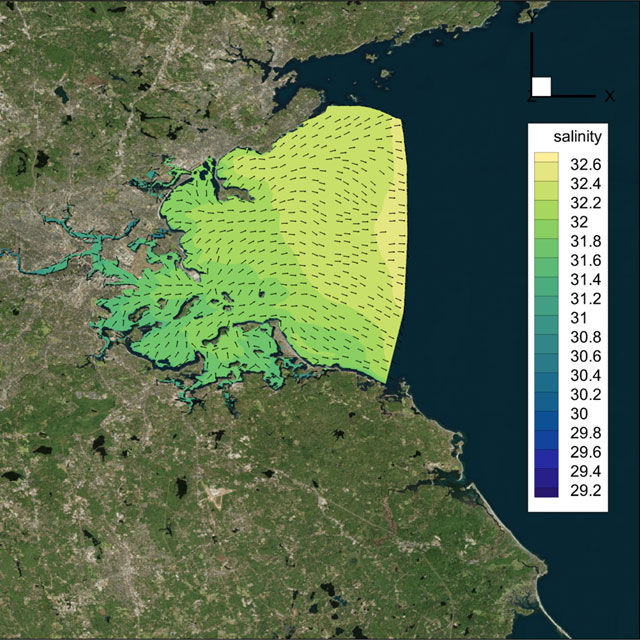
Tecplot 360 plot showing evenly spaced vectors in Boston Bay.
Watch the video »
The goal of these Getting Started with Tecplot 360 training sessions is to increase your efficiency when visualizing and analyzing CFD results. Each session uses a different dataset, so they cover slightly different capabilities. But all sessions cover the basics: user interface, loading data, creating slices, iso-surfaces, and streamlines, and exporting images, animations, and videos. If you have a recommendation for an upcoming training session, we would love to hear about it.
You can watch this training session video, register for upcoming, and watch recorded training sessions.
These questions were answered by Scott Fowler, Tecplot 360 Product Manager, and Jared McGarry, Tecplot Account Manager.
Does the georeferenced image come in the netCDF file?
No, the georeferenced image was not in the netCDF file. We used the tool QGIS to create that image. If you are not familiar with QGIS, it is a free open source tool. If you need help creating images using that tool, our support staff does have some experience with it. We are not geoscience experts here at Tecplot, but can help with some of these file formats.
What netCDF-based file formats do you support?
The FVCOM loader is on by default in the Tecplot 360 installation. ROMs and WRF loaders are included in the installation, but they are not on by default. If you want to use ROMs or WRF formats, please contact us and we can help you enable them. The ROMs and WRF loaders are still in Beta and when they’re ready for prime time, we will turn them on by default.
Can I import Shapefiles?
Yes, but Tecplot 360 does not have a direct loader for it. We have a Python script available on Tecplot’s GitHub page which can convert Shapefiles to Tecplot binary (.plt) format. You can then load the PLT file directly. This video shows you how to Convert Shapefiles to PLT Using PyTecplot.
Can Tecplot 360 create Schlieren Images?
Schlieren images are frequently used for a high-speed aircraft. Tecplot 360 cannot create Schlieren, but it can do Shadowgraph. If that is a good alternative for you, here are two video tutorials that may help:
Can I use the polyline to do a transect and make a vertical plot along that line?
This is not built into the Tecplot 360 directly, but we have written a Python script for this purpose. The Python script requires FVCOM data and the use of the siglev variable. Here is a video tutorial to walk you through Computing a Vertical Transect in Tecplot 360.
How do I change the X-axis to distance instead of points?
The best way to calculate a new distance variable along the X-axis is to use our Python API, PyTecplot. At each point you will be able to get the X and Y values and compute distance using the Pythagorean distance. Our Support Team can certainly help you with the script.
If you need distance, the vertical transect script mentioned in the previous question will compute distance along the line for you.
How can you show time on the plot as you animate through time?
One way to show real-time values in an animation is to create a text box, click to place it, and then use dynamic text. The dynamic text, &(SOLUTIONTIME), refers to solution time. As you step through time, the solution time will update and show the current value on the frame itself.
How does Tecplot 360 deal with large movie exports?
Here are a few things you can do to speed up the export of large movie files:
- Reduce the anti-aliasing value or turn it off altogether. Antialiasing can slow down exports, especially for larger image sizes.
- Export a sequence of images instead of a movie file. You can then stitch the images together. This works especially well if you have many time steps. One advantage is this allows you to adjust items like framerate without having to reload all the data.
- Knowledge Base article: Use FFmpeg to create videos from PNGs
- Knowledge Base article: Creating a GIF from a Sequence of PNGs
As you animate, or progress, through time, Tecplot 360 will continue to load data, and so you will see an increase in the amount of RAM used, but never fear! Tecplot 360 has an intelligent strategy for offloading data, which frees up RAM. The oldest data is offloaded first, using a cell-aging algorithm. For batch mode operations or movie file exports you may want to adjust the Load-on-Demand settings to Minimize Memory Use. This can be found on the Misc tab in the Options>Performance dialog.
One more thing to note if you have cell-centered data in your dataset, many Tecplot 360 algorithms require that data be interpolated to the nodes. This is important because nodal values are computed, and then stored in a temporary location. This is done so the nodal values do not have to be recomputed later. We have had a few people run out of disk space because they were doing many computations on large simulations. To prevent running out of disk space, make sure that your temporary directory has plenty of room. Tecplot 360 has options to specify the temporary directory location.
When extracting a polyline, will the polyline data change with the time step selected or will a new polyline be required for different solution times?
Extraction happens only at the current time step, so a new extraction will have to be performed at each timestep.
Here are three different ways to extract a polyline:
- Draw the polyline and extract the points.
- Extract polyline over time by selecting the polyline and going to Data Extract>Extract polyline over time, Use the 2D Cartesian plot type, not the XY line plot type.
- Use the state to extract a precise line and specify the exact start and end points for the polyline along a surface, or even through a volume.
Can Tecplot 360 download 2D variables from FVCOM or the depth of average velocity components?
The answer is no, currently not, but we have experimented with a loader to do that. If you need this capability, please contact us at support@tecplot.com, and we can work with you to update the loader.
Can I use an imported Google earth image as a georeferenced image?
The answer is maybe. Certainly, Tecplot 360 can import any image into the plot. If you have an image, you need an associated world file, in this case a PGW file (a PNG world file) which defines the region of that image. If you do not have a world file, you can import the image and then pan and zoom to get it to line up with your data.
Can the polyline be used to show transient data where the X axis is the polyline curvilinear axis and the Y axis is the variable that changes in time?
A polyline will not work for this, but there is a way to show the behavior of the variable over time at a specific point. Use the Probe tool to create a time series plot. At the probed area, Tecplot 360 will extract a new region of data at that specific point. This new region can be used to show a line plot of that variable over time. The two plots are automatically linked, so when you step through time, you will see the salinity (if salinity is the variable) behavior at that point. And then you will see the bar indicating the current time step at that point.
Is it possible to animate the XY along with the other frames in your demo?
2D and 3D plots can be animated through time, but XY line plots do not have the capability. To get around this, you can represent a line plot using the 2D plot type. You will not have the multiple Y axes capability, but you can simulate a line plot using the 2D plot types.
Can you show solution time in days such as year, month, day, hour?
Many FVCOM models have solution times are Number of Days since a specific date and time. Tecplot 360 does not inherently display a date and time. However, you can use a PyTecplot script to add Auxiliary Data to the zones that include the actual time.
===CreateAuxDate.py====
import datetime
import tecplot as tp
initial_date = datetime.datetime(1858, 11, 17)
tp.session.connect()
with tp.session.suspend():
for z in tp.active_frame().dataset.zones():
t = initial_date + datetime.timedelta(z.solution_time)
z.aux_data["Date"] = t.strftime("%m/%d/%Y %H:%M:%S")
You can then add text to the plot by clicking the Add Text icon on the toolbar or by using Menu>Insert >Text. Then type in the text field:
&(AUXZONE[ACTIVEOFFSET=1]:Date)
Getting Started with Tecplot 360
If you still have questions or recommendations for upcoming training, Contact Us.