


 MENU
MENUIsosurfaces are a 3D tool in Tecplot 360 that show the value as well as the shape of your flow. In a previous video tutorial, we demonstrated Placing Slices on your plot. Slices are helpful not only for visualizing your flow and seeing what’s going on in your domain, but they are a useful tool for figuring out where to put an isosurface (as well as where to Add Streamtraces).
Placing Isosurfaces
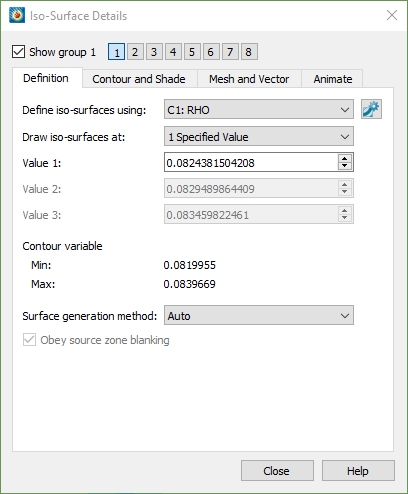 In this plot, I want to define an isosurface using the RHO variable and show that isosurface at a specific value. To do that, first open the Isosurface Details dialog.
To find a good value of RHO, use the Probe tool and probe on an area of interest.
I can Zoom in closer on the plot with the Probe tool still active by clicking and holding the middle mouse button. Probe by clicking at a point of interest and view the variables in the Probe sidebar. Copy and paste the value into The Isosurface Details dialog Value 1. Then toggle on the isosurfaces in the plot sidebar.
Power Switches
Note that the toggles in the Plot sidebar are power switches that turn on and off plot features. For example, if I had multiple isosurface groups or multiple slice groups displayed, I would turn on and off all slices and isosurfaces by toggling the switches. Individual groups can be toggled on and off in the Isosurface Details dialog.
Styling Isosurfaces
Now I have an isosurface going through my domain at a location of interest. The isosurface can be made translucent by right-clicking on the isosurface and setting the translucency (to 30) in the context menu.
There are two ways to adjust the look of your isosurface.
- The Context Menu – by right-clicking on the isosurface to open the context menu where the mesh, vectors, shade, and translucency can be adjusted.
- Or the Isosurface Details dialog – Double-click on the isosurface to open this dialog to adjust the Contour, Shade, Mesh, Vectors, or to Animate.
Animating Through Time
To animate through time, click the video-like play control in the Plot sidebar.
Extracting Isosurfaces
Normally, isosurfaces are derived from the dataset “on the fly” and do not add any data to the dataset. To extract existing isosurfaces to Tecplot zones, allowing you to retain them even if the contour variable is changed, select Extract>Iso-Surfaces from the Data menu.
Once extracted, you can also write the new Isosurface Zone to a separate data file under the File dropdown menu.
Conclusion
This concludes the tutorial for working with Isosurfaces. Thank you for watching.