


 MENU
MENUQ&A from the Webinar
Q: Do you have a basic tutorial on using macros? [01:41]
Yes! here are three places to start:
- A good place to start learning Macros is in the Scripting Guide.
- Try Recording Macros
- Contact support@tecplot.com for help
Q: Do you have a basic tutorial on using PyTecplot? [0:02:50]
Yes! Here they are:
- The guide to all things PyTecplot in our PyTecplot Docs.
- The Getting Started Page, Step 5 Automating Your Workflows
- Try recording PyTecplot scripts – this is a great way to learn PyTecplot.
- Check out our handy scripts GitHub – copy/past scripts from here!
- Contact support@tecplot.com
And here’s a tip: Try running your PyTecplot scripts in batch mode – it’s faster and doesn’t consume a 360 GUI license
Q: How can I compute a time average? [04:21]
Computing a time average is a great way to see the overall trends in a transient simulation. So how do you do it?
If your grid is the same at each timestep
Write the equation:
{UAvg} = ({U}[1] + {U}[2] + {U}[3]) / 3
This equation computes the average of the ‘U’ variable for zones 1,2,3.
What if you have lots of zones?
- Write a macro
- Write a Python script
- Use TimeAverage.py (available on our GitHub)
Note: This also requires that the grid nodes be in the same order. We’ve seen grids exported from Ansys Fluent to PLT format have the same logical grid, but the node indexes are in a different order.
What if my grids are different at each timestep?
If your grid changes at each time step, say you’re using adaptive mesh refinement – you’ll have to create a common grid at each time step and interpolate to it. Then perform the time average on the common grid.
For volume data, Linear Interpolation should work.
For surface data, use Inverse Distance Interpolation.
Q: What are the system requirements for Tecplot 360? [20:03]
It depends! Seriously, it does.
The performance of Tecplot 360 is dependent on:
- CPU speed and number of cores
- Available RAM
- Disk/Network speed
- Graphics card (GPU)
How much of each resource is used by Tecplot 360 is heavily dependent on your data and post-processing activities.
- CPU: Slices, Iso-surfaces, streamtraces, variable calculations, interpolation
- RAM: Dependent on grid size, type, and number of variables required for your visualization/analysis. RAM consumed by 360 can be limited adjusting Load On Demand settings.
- Disk/Network Speed: The disk/network is hit every time 360 needs to load data (and sometimes when 360 needs to unload data)
- Graphics card: Used for rendering. Iso-surfaces and scatter symbols can be particularly expensive.
Can you give me a recommendation?
Sure, but these are wide ranges:
- CPU: 8-40 logical cores
- RAM: 32-256 Gb
- Disk/Network: The fastest SSD and network connection you can afford
- Graphics Card: Most any modern graphics card will work reasonably well. Even Intel Integrated Graphics are able to handle some of the larger datasets we’ve seen.
Grab your largest simulation results and go through your regular post-processing steps using existing hardware. Keep an eye on Task Manager (or similar) and keep track of what resource may be your bottleneck. Adjust Tecplot 360 to use “Minimize Memory Use” to discover the minimum RAM requirement.
Q: How can I write Tecplot format from my solver? [27:47]
Use the TecIO library. It’s free! TecIO source code is available for download so you can compile it on your architecture.
- TecIO-MPI can write to SZPLT format in parallel using MPI-I/O
- C and Fortran support
- Python wrapper available (work in progress)
- A new API allows for:
- More flexibility in variable types, leading to smaller files.
- Reading of SZPLT files – no vendor lock-in!
- Easier management of writing multiple files simultaneously
- Limited to SZPLT file format
- Legacy API is still available
- Got transient data?
- Use grid and solution files
- Or grid/variable sharing if you want a single file for all your data
Check out our webinar on Back to Basics: TecIO.
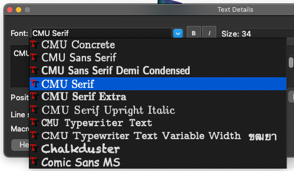
Q: How can I utilize Computer Modern font in 360? [31:28]
Here’s the procedure:
1. Download the Computer Modern font (or any font of interest). The font I’ll be using was downloaded from https://sourceforge.net/projects/cm-unicode/.
2. Edit your tecplot.cfg file by adding the standard and new font folder locations as follows:
# Adding custom fonts:
$!Interface FontPath = ' "/Users/brandon/Customization/cm-unicode-0.7.0" "/System/Library/Fonts" '
Note, I edited the tecplot.cfg file in my 360 installation directory: /Applications/Tecplot 360 EX 2021 R2/tecplot.cfg
More tips on where to place your tecplot.cfg file can be found in Section 30-1 of the User’s Manual: Custom Files Loaded on Startup.
3. Restart Tecplot 360
4. You should be able to select the font of interest in the dialogs shown in the image below.
Q. How can I transform coordinates in Tecplot 360? [35:49]
Here are a couple of approaches:
- Use the macro language (see more in the Scripting Guide)
PolarToRect, RectToPolar, SphericalToRect, RectToSpherical:
- $!TRANSFORMCOORDINATES
- For example:
$!TRANSFORMCOORDINATES
TRANSFORMATION = RECTTOPOLAR
ANGLESPEC = DEGREES
CREATENEWVARIABLES = YES
XVAR = 1
YVAR = 2
2.Automating with PyTecplot (see the PyTecplot Docs):
- data.operate.transform_polar_to_rectangular()
- data.operate.transform_rectangular_to_polar()
- data.operate.transform_rectangular_to_spherical()
- data.operate.transform_spherical_to_rectangular()
3. The Specify Equations dialog
Q. How can I calculate the velocity vector components normal to a surface using Tecplot 360? [37:17]
We will follow the following procedure in the video at [38:25]:
- First, we will calculate the unit normal vectors to the surface
- Then, using the dot product, I’ll calculate the normal velocity magnitude at each node of the surface
- Finally, I’ll multiply the unit normal vectors calculated in step #1 by the dot product calculated in step #2 and visualize the vectors on the plot
Q. How do I overlay two plots? [41:05]
Using multiple frames and frame linking, you can overlay plots that may not be compatible on the same frame:
- Plot data for one plot in a standard frame.
- Create a new frame (Frame>Create New Frame).
- Create a second plot in the new frame.
- Link frames so that they have a matching size and position
- Frame>Frame Linking, enable the Frame Size and Position option and apply it to the two frames.
- Hide the background on the top frame (Frame>Edit Active Frame when the top frame is active, deselect show background).