Loader, Platform & Python Support Updates in Tecplot 360 2022 R1
Tecplot 360 2022 Release 1 includes important platform and Python version support updates.
Helping usher in the future of CFD, Tecplot, Inc. is supporting higher-order elements with a technology preview available as a separate (Beta) download.

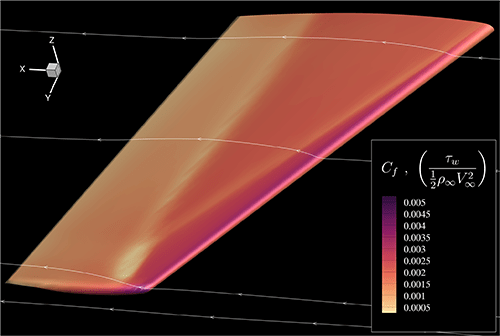
LaTeX Support in Contour Legends
Highlights of Tecplot 360 2022 R1 include:
- High Order Element Technology Preview
- LaTeX Support in Contour Legends
- TecIO Performance Improvements
- Loader Updates and Performance Improvements
- Supported Version Updates
- See all 360 Updates
Download Tecplot 360
This new release is available for download as Free Trial Software, or for customers through the Customer Portal.
About Tecplot 360
Tecplot 360 is a suite of CFD visualization and analysis tools that can handle large data sets, automate workflows, and visualize parametric results. Three powerful modules in this one tool include:
- PyTecplot – a Python API for automating workflows.
- Chorus – an analytics tool for exploring large datasets composed of multiple solutions or experiments.
- SZL Server – a client-server module for accessing data remotely.
Integrated XY, 2D and 3D plotting speeds data analysis and increases productivity. Easy-to-use, fast and memory efficient, Tecplot 360 produces visually powerful output to help engineers and scientists communicate CFD, other simulation and test data results to clients and stakeholders.
PyTecplot, Chorus, and SZL Server are available for customers on maintenance service and anyone who downloads a free trial of the software.
Special pricing is available for Academic users upon request, see Tecplot for Academics.
About Tecplot, Inc.
Tecplot, Inc. is the leading post-processing software developer in CFD data visualization. We believe visual analysis is the key to unlocking information hidden in complex data, leading to world-changing discoveries and innovation. Not only do we empower engineers and scientists to visualize, analyze, and understand information in simulation and test data results, but through our high-resolution images and animations, we help them clearly communicate their results to stakeholders.
Tecplot software differs from other visualization tools in that it is easy to learn and use, offers broader capabilities, and produces better-quality images and output.
Contact
Margaret Connelly
Marketing Manager, Tecplot
pr@tecplot.com
(425) 653-1200


