


 MENU
MENUIt’s the way things usually work. As a CFD engineer using numerical simulation to study fluid flow in a reservoir you’ll typically first approach the problem by looking for two main things: what you know and what you don’t know.
After all, that’s what simulations are for, right?
Well, not so fast. Allow us to explain . . .
There are 3 things visualization software can show you.
1. Visualization Software Shows You What You Know
Sure, this is important. In order to be effective engineers, we have to use the information we’ve spent so much effort acquiring—of which there’s usually enough to fill a book. But, here’s the problem: If we were to write that book, it probably wouldn’t sell many copies. That’s because what we know is often already known by plenty of our colleagues—and what they really need is the same thing we need: the unknowns.
2. It Shows You What You Don’t Know
And so, we take our simulation analyses to the next step, and here’s where Tecplot 360 visualization software starts to come in handy: it shows us what we don’t know – but do know enough to look for. Finding the anomalies in our simulations is just a part of the way we typically work—it’s simply being a human (engineer).
And that’s a good thing.
Often the answers you get by following steps 1 and 2 provide us with more than enough information to do our jobs proficiently. Chances are, you’ll even get a raise at the end of the year. But real innovation happens outside of what we know and what we don’t know.
That’s right: Almost every technical innovation is born when a human brain ventures into new territory.
That’s when you notice connections you never thought to look for before, between datasets that are seemingly dissimilar and unconnected.
And then, in a flash, it hits you:
3. You See What You Don’t Know that You Don’t Know
We’ve all had those moments at which inspiration strikes us and we have an idea that’s sheer genius. Over the years, we humans have ascribed those moments to the muses, the gods, and a lot more. But actually, there are processes and consultants who can train our minds to have more of those moments. And, for engineers using numerical simulation, there’s even some software that helps.
Tecplot Chorus is one of them.
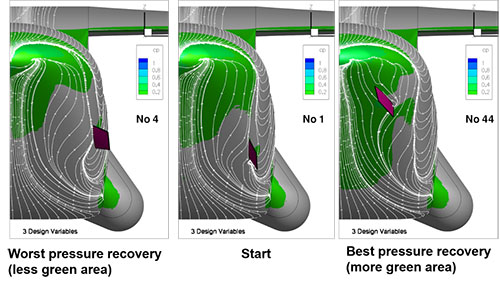
Tecplot Chorus (included with Tecplot 360*) brings together CFD project results from multiple simulation cases, derived quantities, and plot images into a single environment. This integration enables you to evaluate overall system performance and visually compare tens or even hundreds of simulation cases without writing scripts.
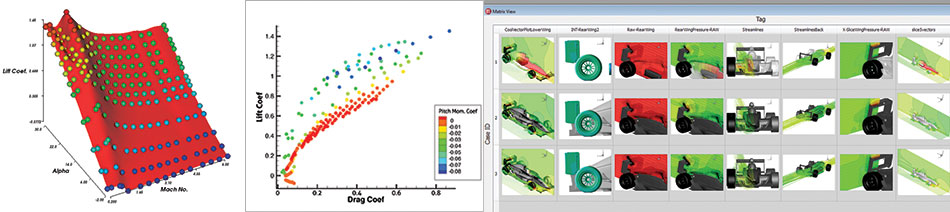
Engineers and scientists can look at the systems they are studying in multiple views in the system. It’s especially useful when looking at system performance in complex geometries. The result is a deeper “a-ha moment” for than you’ve ever experienced before.
And I think we could all use a few more of those.
Try Tecplot 360 with Chorus for Free
* Tecplot Chorus is included with the free trial or TecPLUS licensed software.